
The things people rant about the most are money, politicians and other people. In a Talker Research survey of 2,000 Americans published in May 2024, grocery prices topped the list of recent annoyances at 47%, followed by politicians at 41% and other people’s driving at 29%. Crowds, the weather, customer service and social media trends filled out the rest of the top seven.
Surveys like that capture everyday grumbling. Formal complaint records tell a sharper story, because they show what people were angry enough to report. This guide ranks the most common rants using the survey data, then checks each one against harder evidence: federal fraud reports, traffic studies, customer service research and polling on tipping and travel manners.
Grocery Prices, Traffic Hours and Scam Losses Top the Gripes
- Grocery prices (47%), politicians (41%) and other people’s driving (29%) were the top three annoyances in Talker Research’s 2024 survey of US adults.
- The average US driver lost 49 hours to congestion in 2025, worth about $894 in time, according to INRIX. Chicago drivers lost 112 hours.
- Americans filed 3 million fraud reports with the FTC in 2025 and reported losing $15.9 billion. Imposter scams were the most reported type, with over 1 million reports.
- 74% of consumers had a product or service problem in the past year in the 2023 National Customer Rage Survey, and 43% yelled or raised their voice about it.
- On planes, drunkenness (76%), skipping headphones (63%) and public grooming (62%) were the behaviors Americans found least acceptable in a YouGov survey.
The Things People Rant About the Most, Ranked
The clearest ranking of modern complaints comes from Talker Research, which asked 2,000 US adults in April 2024 which things had annoyed them in the previous 90 days. People could choose more than one item, so the percentages add up to more than 100. The survey ran online from April 3 to 8, 2024, with a margin of error of plus or minus 2.2 points.
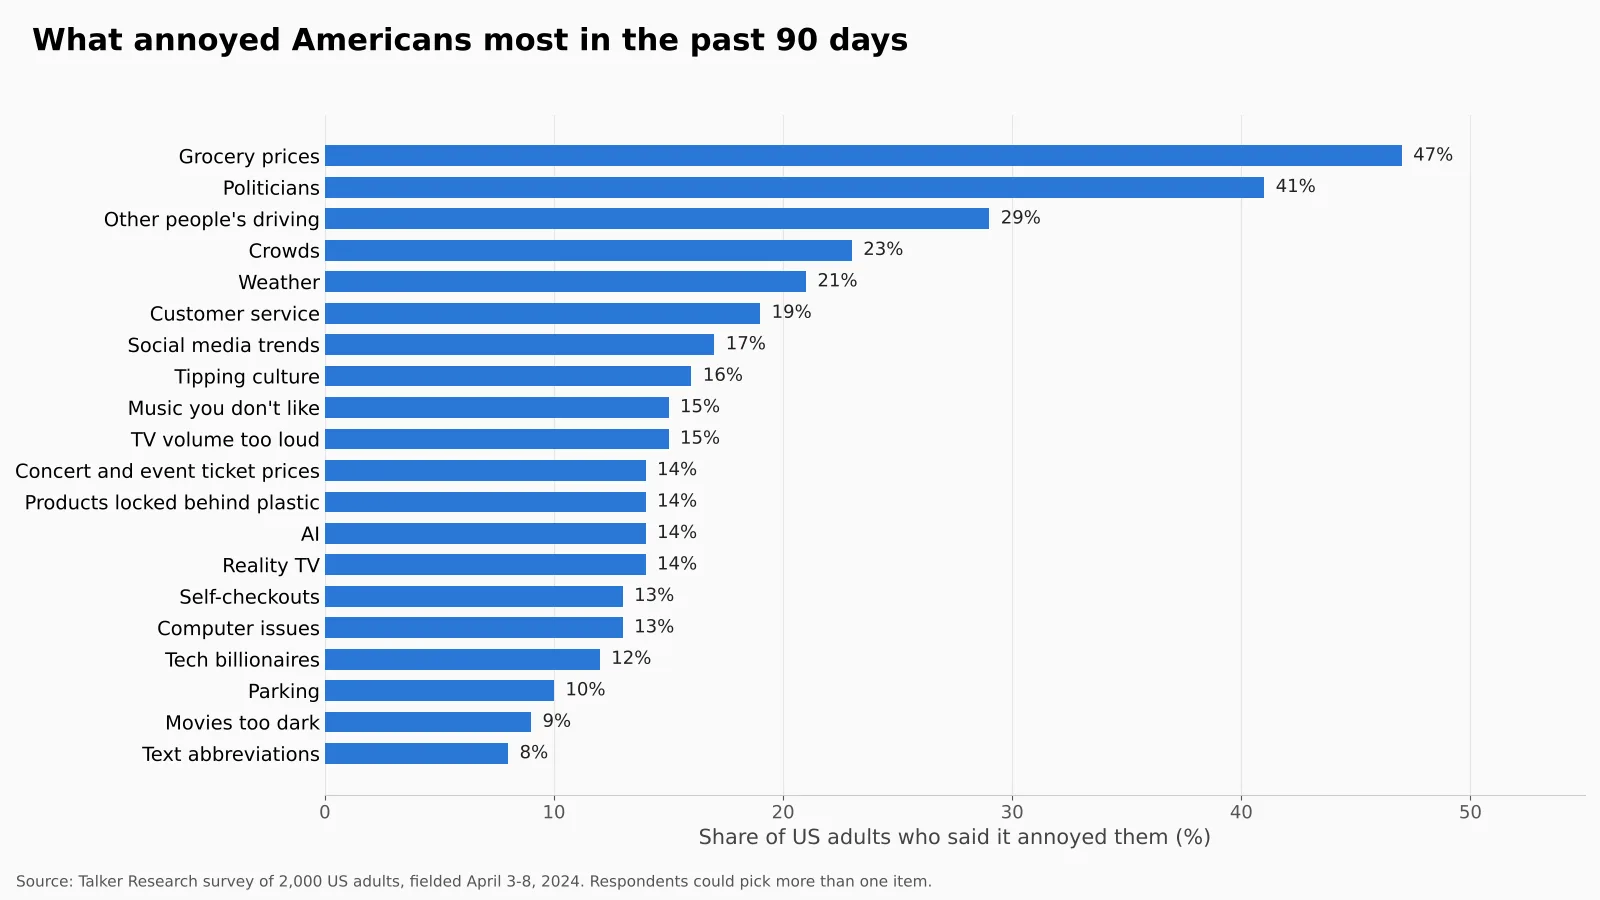
The list sorts neatly into a few themes. Prices show up four times (groceries, tipping, tickets and products locked behind plastic, which is partly a shopping-cost complaint). Technology appears five times. Other people, whether behind the wheel, in a crowd or on a reality show, run through the whole list. The table groups each annoyance by theme and points to the stronger data covered later in this guide.
| Rank | Annoyance | Share Annoyed | Theme |
|---|---|---|---|
| 1 | Grocery prices | 47% | Money and prices |
| 2 | Politicians | 41% | Politics |
| 3 | Someone else’s driving | 29% | Traffic and commuting |
| 4 | Crowds | 23% | Other people in public |
| 5 | Weather | 21% | Things nobody controls |
| 6 | Customer service | 19% | Shopping and service |
| 7 | Social media trends | 17% | Technology and online life |
| 8 | Tipping culture | 16% | Money and prices |
| 9 | Music you don’t like | 15% | Entertainment and home |
| 10 | TV volume being too loud | 15% | Entertainment and home |
| 11 | Concert and event ticket prices | 14% | Money and prices |
| 12 | Products locked behind plastic | 14% | Shopping and service |
| 13 | AI | 14% | Technology and online life |
| 14 | Reality TV | 14% | Entertainment and home |
| 15 | Self-checkouts | 13% | Shopping and service |
| 16 | Computer issues | 13% | Technology and online life |
| 17 | Tech billionaires | 12% | Technology and online life |
| 18 | Parking | 10% | Traffic and commuting |
| 19 | Movies being too dark | 9% | Entertainment and home |
| 20 | Text language and abbreviations | 8% | Technology and online life |
Prices: Groceries, Tips and Tickets Lead the Rants
Money complaints top the list for a simple reason: everyone buys groceries, usually every week, so a higher bill is a frustration people meet again and again. In the Talker Research survey, nearly half of adults (47%) named grocery prices as a recent annoyance, a bigger share than any other item. Concert and event ticket prices added another 14%. Household bills feed the same mood, and our breakdown of the average electricity bill by state shows how widely those costs vary across the country.
Why Tipping Culture Sets Off So Many Arguments
Tipping drew 16% of respondents in the Talker survey, and broader polling explains why. A Pew Research Center survey published in November 2023 found that 72% of US adults said tipping is expected in more places than it was five years earlier. A tip request at a self-serve kiosk or a takeout counter feels different from tipping a server, and that gap between old habits and new screens is exactly the kind of thing people vent about.
Politicians: The Second Biggest Source of Irritation
Politicians came second, named by 41% of respondents as a recent source of irritation. That is a large share for a topic most people experience through news and social media rather than in person.
We would not read too much into the exact figure. The survey was fielded in April 2024, during a presidential election year, when political coverage was everywhere. A survey run in a quieter year might put politicians lower on the list, but they would almost certainly still rank near the top.
Other People’s Driving, Traffic and Parking
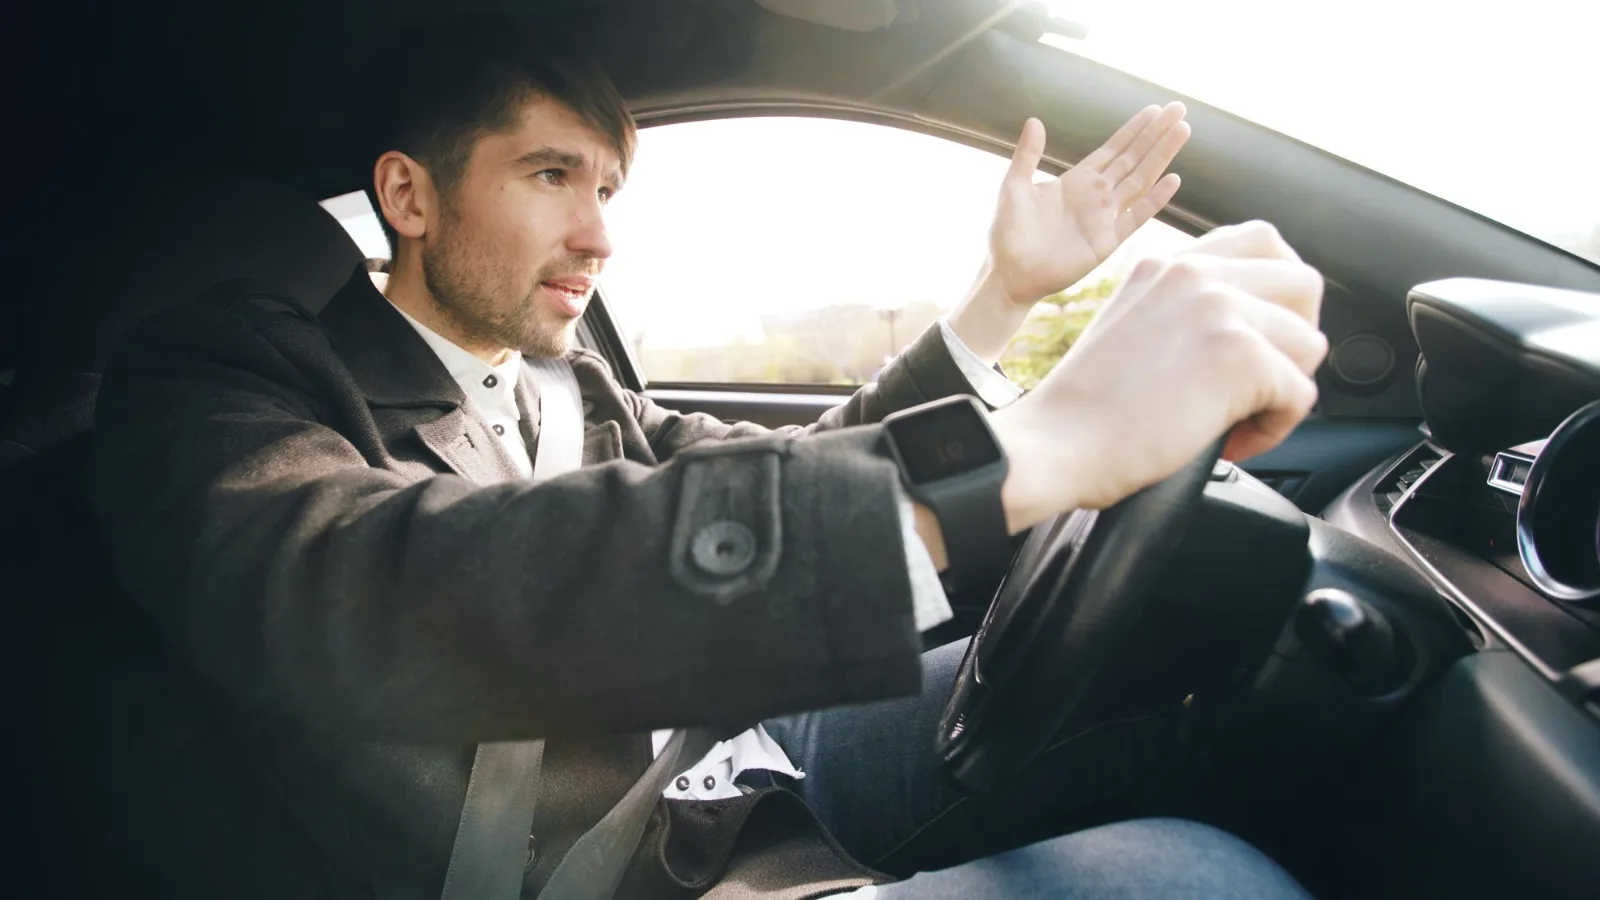
Bad driving was the third most common annoyance at 29%, and parking added 10%. Traffic data backs up the frustration. The INRIX 2025 Global Traffic Scorecard, published in December 2025, found that the average US driver lost 49 hours to congestion in 2025, six hours more than in 2024. That lost time was worth about $894 per driver, and at least $85.8 billion nationally.
Forty-nine hours is a little over two full days spent sitting in slow traffic. In some cities it is far worse: INRIX put Chicago at the top of the US list, with 112 hours lost per driver, up 10% on the year. Los Angeles drivers lost 86 hours, a 1% drop. Congestion rose in 248 US urban areas, fell in 12 and stayed flat in 30, so most commuters really did spend more time stuck.
| Traffic Measure (INRIX, 2025) | Figure |
|---|---|
| Average hours lost per US driver | 49 hours (up 6 hours from 2024) |
| Value of time lost per driver | About $894 |
| National cost of lost time | At least $85.8 billion |
| Most congested US city | Chicago, 112 hours per driver (up 10%) |
| Los Angeles | 86 hours per driver (down 1%) |
| US urban areas with more congestion | 248 (12 had less, 30 unchanged) |
It is easy to see why drivers blame each other. Traffic delays are shared, but every slow merge or sudden lane change feels personal from behind the wheel. Cities that try to pull people out of cars often start with transit, and some have gone as far as making it free, as our list of cities with free public transportation shows.
Crowds and Bad Manners in Shared Spaces
Crowds annoyed 23% of Americans in the Talker survey. A crowd is where small annoyances add up: slow walkers, loud phone calls, someone taking up two seats. Airplanes are the extreme version, because passengers cannot leave, and they generate some of the most detailed etiquette polling available.
A YouGov survey conducted in February 2023 asked adults in 18 markets which inflight behaviors they found unacceptable. Among Americans, drunkenness topped the list at 76%, followed by watching media without headphones (63%) and grooming in public, such as clipping nails (62%).
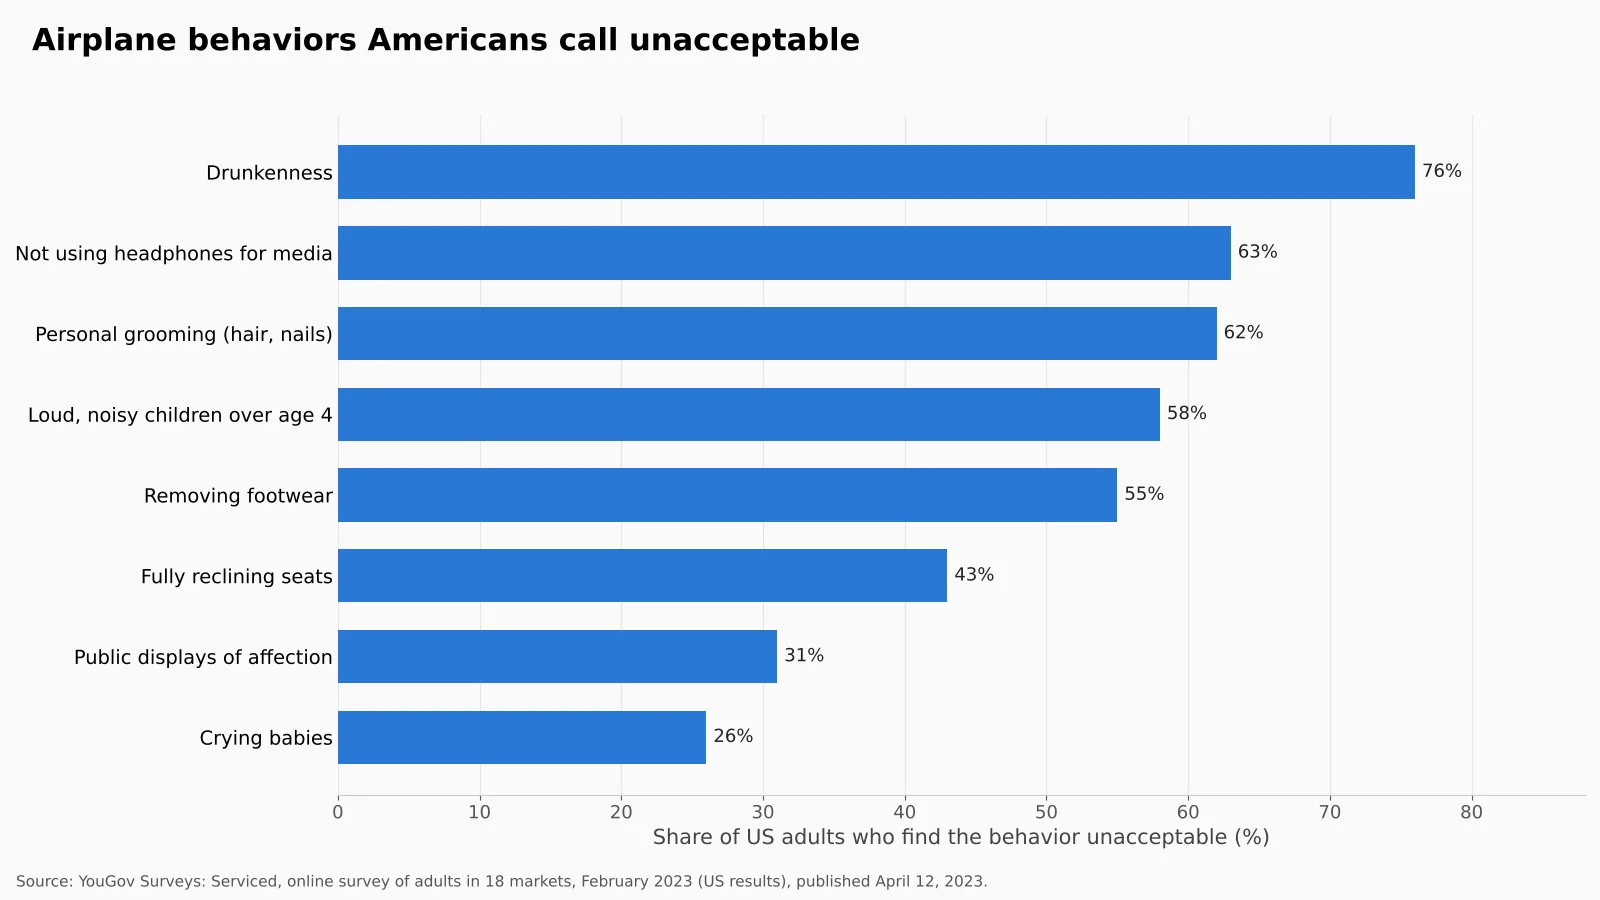
Some details in the YouGov data are revealing. Only 26% of Americans called crying babies unacceptable, which suggests most people accept what parents cannot control and save their anger for choices, like skipping headphones. Americans were less bothered than British respondents by fully reclined seats (43% against 59%) but more bothered by bare feet (55% against 48%). Age mattered too: 89% of Americans aged 55 and over found drunkenness on a flight unacceptable. Travelers stuck through long layovers may also appreciate our guide to US airports with sleeping pods.
The Weather: The Rant Nobody Can Fix
One in five respondents (21%) said the weather had annoyed them recently. Weather complaints are different from the others on this list because there is nobody to blame and nothing to change. That is probably why they work so well as small talk: grumbling about rain or heat is a safe way to agree with a stranger.
Customer Service, Self-Checkouts and Locked-Up Products
Customer service annoyed 19% of the Talker panel, products locked behind plastic annoyed 14%, and self-checkouts annoyed 13%. All three describe the same feeling: a store or company making the customer do more work, or wait longer, to buy something.
Long-running research suggests these complaints are growing. In the 2023 National Customer Rage Survey, 74% of consumers said they had experienced a product or service problem in the past year, the highest share since the survey began and up 8% since 2020. The survey is run by Customer Care Measurement and Consulting with the Center for Services Leadership at Arizona State University’s W. P. Carey School of Business. According to reporting on the same survey, the rate of problems has more than doubled since 1976, and 43% of customers yelled or raised their voice about their most serious problem, up from 35% in 2015.
| Customer Service Measure | Figure | Source |
|---|---|---|
| Consumers with a product or service problem in the past year (2023) | 74% | National Customer Rage Survey |
| Customers who yelled or raised their voice about their worst problem (2023) | 43% | National Customer Rage Survey |
| Same measure in 2015 | 35% | National Customer Rage Survey |
| Adults annoyed by customer service in the past 90 days (2024) | 19% | Talker Research |
| Adults annoyed by self-checkouts (2024) | 13% | Talker Research |
For businesses, the lesson is uncomfortable but useful: the complaint itself is rarely the end of the story. How a company handles a return, a refund or a fault decides whether the customer calms down or starts posting. Clear policies help, and our collection of ecommerce return policy examples shows how online stores spell out the rules before anyone has to ask.

Scams and Fraud: What Americans Formally Complain About
Casual rants and formal complaints are not the same thing. When people go to the trouble of filing a report with the government, the most common subject is fraud. The Federal Trade Commission told Congress in March 2026 that consumers submitted 3 million fraud reports to its Consumer Sentinel Network in 2025 and reported losing $15.9 billion. In 2024, the figures were 2.6 million reports and over $12 billion in losses.
Imposter scams, in which a scammer poses as someone the victim trusts, were the most reported type of fraud, with over 1 million reports and over $3.5 billion in losses. Investment scams caused the most damage in dollar terms: over $7.9 billion, about half of all reported losses, with an average loss of more than $10,000 per person.
| FTC Fraud Measure (2025) | Figure |
|---|---|
| Fraud reports filed | 3 million (2.6 million in 2024) |
| Total reported losses | $15.9 billion (over $12 billion in 2024) |
| Most reported fraud type | Imposter scams: over 1 million reports, over $3.5 billion lost |
| Costliest fraud type | Investment scams: over $7.9 billion lost |
| Most common contact method | Text message |
| Contact method with the highest losses | Social media, over $2 billion |
| Payment method with the highest losses | Bank payments, followed by cryptocurrency |
The contact data explains a lot of everyday irritation. Text messages were the most common way scammers reached people, which helps explain why scam texts have become such a common gripe. Cryptocurrency ranked second for total losses by payment method, and anyone who holds coins should know the basics of protecting a wallet, such as crypto address whitelisting. If a scam reaches you, the FTC collects reports through its Consumer Sentinel Network, which is where these numbers come from.
Technology and Online Life: Social Media, AI and Tech Billionaires
Technology shows up five times in the Talker top 20. Social media trends annoyed 17% of adults, AI annoyed 14%, computer problems 13%, tech billionaires 12%, and text abbreviations 8%. Taken together, tech is the most common theme on the list, even if no single tech complaint comes close to grocery prices.
AI is the newest entry on lists like this one, and its spread into search results, customer support and social feeds gives people plenty of chances to run into it. People who want to check whether a picture is real can use one of the websites that detect AI-generated images. And since so much ranting now happens on X, a clear, honest profile helps; our collection of cool Twitter bios has ideas for every kind of account.
Loud TVs, Dark Movies and Other Living-Room Irritations
The smaller items on the list are the ones people rant about at home. Music you do not like and TV volume being too loud were each named by 15% of respondents. Reality TV annoyed 14%, and 9% complained that movies are too dark to see. None of these is a crisis, but they are the kind of shared annoyance that turns into a running joke among friends and family.
Do People Rant More as They Get Older?
The same Talker Research survey asked whether people had become more positive or more negative with age. More said positive than negative: 18% said much more positive and 26% somewhat more positive, against 5% much more negative and 19% somewhat more negative. A third (33%) could not tell. Among those who felt grumpier, the average age at which it started was 42.
| How Mood Changed With Age (Talker Research, 2024) | Share of Adults |
|---|---|
| Much more positive | 18% |
| Somewhat more positive | 26% |
| Somewhat more negative | 19% |
| Much more negative | 5% |
| Could not tell | 33% |
Adding the groups together, 44% of adults felt more positive with age and 24% felt more negative. So the stereotype of the grumpy older ranter does not hold for most people, even if 42 is a useful number to remember for the next birthday card.
Most Reported Scams, Plane Etiquette and Customer Service Anger
What Do People Complain About the Most?
In a 2024 Talker Research survey of 2,000 Americans, the most common recent annoyances were grocery prices (47%), politicians (41%), other people’s driving (29%), crowds (23%) and the weather (21%).
What Is the Most Reported Scam in the US?
Imposter scams. The FTC said they drew over 1 million reports in 2025, with more than $3.5 billion in reported losses.
How Many Hours Do Americans Lose to Traffic?
The average US driver lost 49 hours to congestion in 2025, according to INRIX, worth about $894 in lost time. Chicago drivers lost the most, at 112 hours.
What Is the Most Annoying Thing People Do on Planes?
Drunkenness. In a 2023 YouGov survey, 76% of Americans called it unacceptable, ahead of watching media without headphones (63%) and grooming in public (62%).
Are People Getting Angrier at Customer Service?
The data points that way. The 2023 National Customer Rage Survey found that 74% of consumers had a product or service problem in the past year, a record for the survey, and 43% yelled or raised their voice about it, up from 35% in 2015.
Talker Research, INRIX Scorecard and FTC Fraud Statistics
- Talker Research: 20 things that Americans find annoying about modern life (May 2024)
- INRIX: Traffic is back, insights from the 2025 INRIX Global Traffic Scorecard (December 2025)
- Federal Trade Commission: Prepared statement to the Joint Economic Committee on the rising scam economy (March 2026)
- Federal Trade Commission: Consumer Sentinel Network
- Arizona State University W. P. Carey School of Business: National Customer Rage Survey highlights (April 2023)
- GPB/NPR: Press 1 for more anger, Americans are fed up with customer service (March 2023)
- YouGov: The dos and don’ts of airplane etiquette (April 2023)
- Pew Research Center: Tipping culture in America (November 2023)