


India’s Most Polluted Cities by 2025 Annual PM2.5
Byrnihat, an industrial town on the Assam-Meghalaya border, had the highest annual PM2.5 of any Indian city on the CPCB continuous monitoring network in 2025, at 100 µg/m³. Delhi came second at 96 and Ghaziabad third at 93. Converted to India’s National Air Quality Index, all three averaged in the “Poor” band for the entire year, with AQI equivalents between 208 and 232.
Those three figures come from government stations alone. To see the wider field, we built a 29-city table from 2025 city averages that draw on CPCB stations plus other monitors, and added each city’s 2024 figure where one exists. The table then shows the change between the two years and the AQI category an average day would fall into. Every percentage and AQI value in it is our own calculation.
| Rank in India | City | PM2.5, 2025 (µg/m³) | PM2.5, 2024 (µg/m³) | Change | India AQI equivalent, 2025 |
|---|---|---|---|---|---|
| 1 | Loni | 112.5 | 91.7 | +22.7% | 274 (Poor) |
| 2 | Byrnihat | 101.1 | No 2024 figure | New entry | 235 (Poor) |
| 3 | Delhi | 99.6 | 108.3 | -8.0% | 230 (Poor) |
| 4 | Ghaziabad | 89.2 | 74.5 | +19.7% | 197 (Moderate) |
| 5 | Ula | 86.8 | No 2024 figure | New entry | 189 (Moderate) |
| 6 | Mullanpur Dhaka | 86.2 | No 2024 figure | New entry | 187 (Moderate) |
| 7 | Madhyamgram | 83.3 | No 2024 figure | New entry | 177 (Moderate) |
| 8 | New Delhi | 82.2 | 91.6 | -10.3% | 173 (Moderate) |
| 9 | Noida | 80.5 | 79.5 | +1.3% | 168 (Moderate) |
| 10 | Greater Noida | 77.2 | 83.5 | -7.5% | 156 (Moderate) |
| 11 | Gurugram | 74.6 | 87.4 | -14.6% | 147 (Moderate) |
| 12 | Bhiwadi | 74.1 | 83.1 | -10.8% | 146 (Moderate) |
| 13 | Hajipur | 71.5 | 71.8 | -0.4% | 137 (Moderate) |
| 14 | Muzaffarnagar | 69.1 | 83.1 | -16.8% | 129 (Moderate) |
| 15 | Talcher | 68.1 | 65.7 | +3.7% | 125 (Moderate) |
| 16 | Hapur | 67.6 | 66.7 | +1.3% | 124 (Moderate) |
| 17 | Baghpat | 65.8 | 47.6 | +38.2% | 117 (Moderate) |
| 18 | Bulandshahr | 64.5 | 60.1 | +7.3% | 113 (Moderate) |
| 19 | Mandideep | 63.0 | 59.5 | +5.9% | 108 (Moderate) |
| 20 | Singrauli | 62.9 | 71.2 | -11.7% | 107 (Moderate) |
| 21 | Barrackpore | 62.6 | 58.4 | +7.2% | 106 (Moderate) |
| 22 | Meerut | 61.8 | 58.7 | +5.3% | 104 (Moderate) |
| 23 | Gummidipoondi | 61.5 | 53.2 | +15.6% | 103 (Moderate) |
| 24 | Mandi Gobindgarh | 60.0 | 78.4 | -23.5% | 100 (Satisfactory) |
| 25 | Baddi | 59.6 | 66.7 | -10.6% | 99 (Satisfactory) |
| 26 | Baruipur | 59.0 | No 2024 figure | New entry | 98 (Satisfactory) |
| 27 | Angul | 58.5 | 67.5 | -13.3% | 97 (Satisfactory) |
| 28 | Bihar Sharif | 57.7 | 43.8 | +31.7% | 96 (Satisfactory) |
| 29 | Pali | 57.7 | 60.2 | -4.2% | 96 (Satisfactory) |
All 29 cities rank in the world’s 50 most polluted for 2025, and India holds 20 of the global top 40. Delhi’s figure here (99.6) differs slightly from the CAAQMS-only figure (96) because the station set is wider. For how these cities compare with Lahore, Hotan and Dhaka, see our ranking of the highest AQI cities in the world.
Which High-AQI Indian Cities Got Worse in 2025
Of the 24 cities with figures for both years, 12 got worse and 12 got better, a perfect split that hides some large moves. Baghpat jumped 38.2%, the biggest rise on the list, and Bihar Sharif rose 31.7%. Loni climbed 22.7% to take the top spot, while Ghaziabad rose 19.7%. On the other side, Mandi Gobindgarh in Punjab fell 23.5% and Muzaffarnagar fell 16.8%. Gurugram dropped 14.6%, the largest fall among the NCR’s big cities.
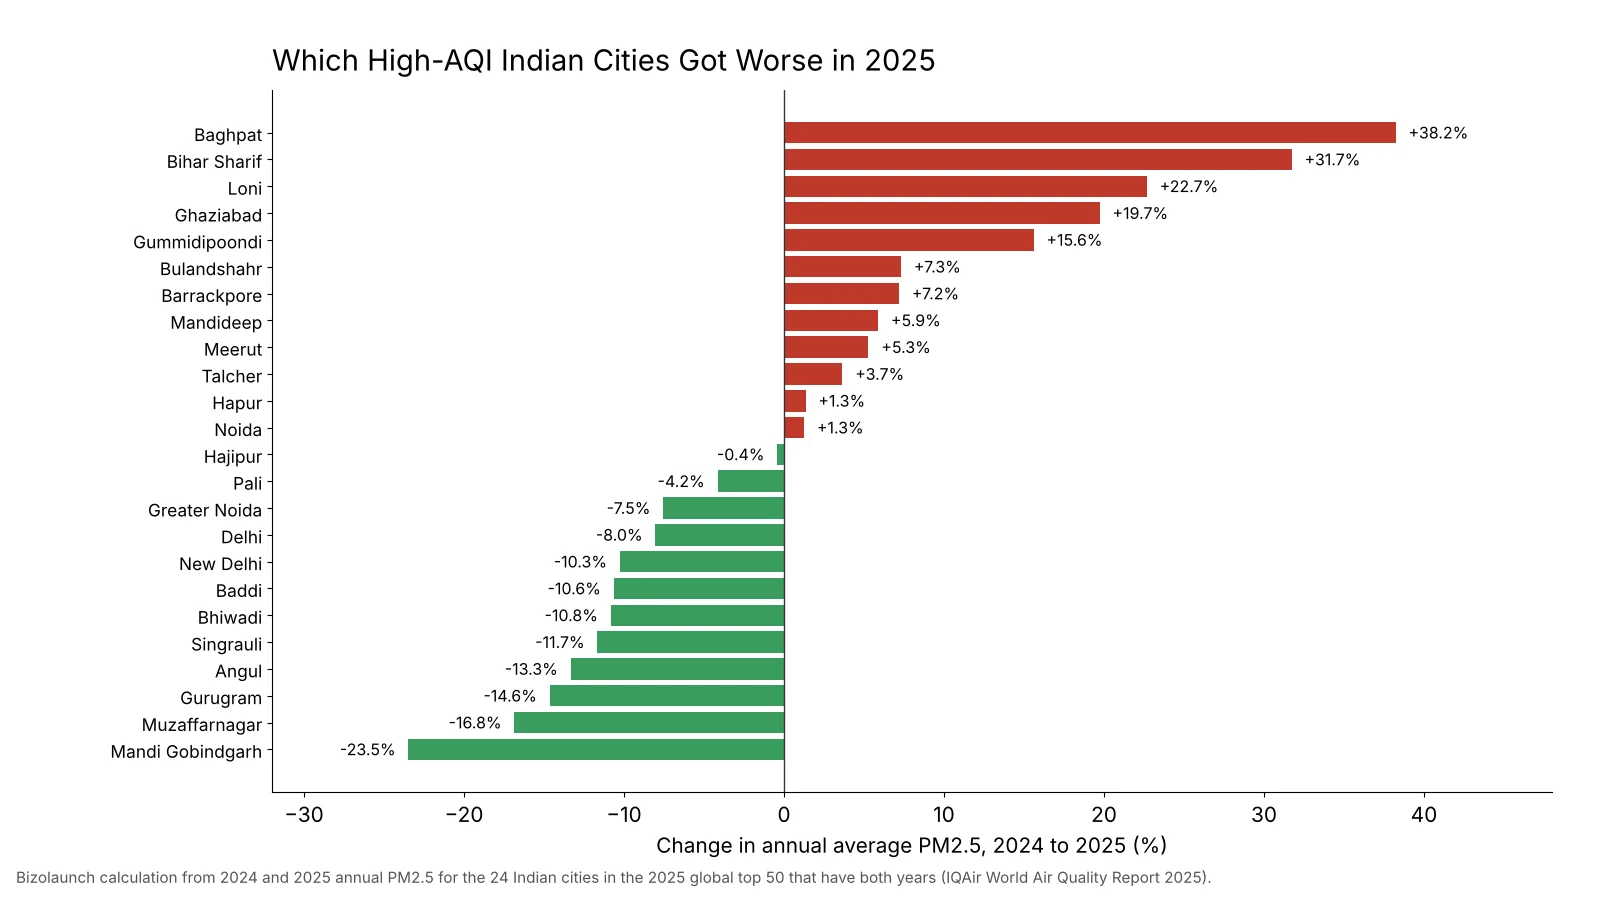
The split matters for anyone reading a single “Delhi improved” headline. Delhi did improve by 8%. Ghaziabad and Loni, a short drive away inside the same airshed, got sharply worse in the same year.
How CPCB Turns Station Readings Into a City AQI
India’s National Air Quality Index, launched on October 17, 2014, rates eight pollutants: PM10, PM2.5, nitrogen dioxide, sulphur dioxide, carbon monoxide, ozone, ammonia and lead. Each pollutant gets its own sub-index. The worst sub-index becomes the AQI. A station needs data for at least three pollutants, one of them PM2.5 or PM10, before an overall AQI is published.
| AQI category | AQI range | PM2.5, 24-hour (µg/m³) | PM10, 24-hour (µg/m³) | Health impact in CPCB’s wording, paraphrased |
|---|---|---|---|---|
| Good | 0 to 50 | 0 to 30 | 0 to 50 | Minimal impact |
| Satisfactory | 51 to 100 | 31 to 60 | 51 to 100 | Minor breathing discomfort for sensitive people |
| Moderate | 101 to 200 | 61 to 90 | 101 to 250 | Breathing discomfort for people with asthma or lung disease, discomfort for heart patients, children and older adults |
| Poor | 201 to 300 | 91 to 120 | 251 to 350 | Breathing discomfort for most people on prolonged exposure |
| Very Poor | 301 to 400 | 121 to 250 | 351 to 430 | Respiratory illness on prolonged exposure |
| Severe | 401 to 500 | Above 250 | Above 430 | Affects healthy people and seriously affects those with existing disease |
The station network behind these numbers had about 1,600 stations in 2025: 565 continuous (CAAQMS) and 1,035 manual, covering 584 cities in 28 states and 7 union territories. Only the continuous stations feed the hourly AQI you see in apps. Manual stations sample on set days, which is why small towns often have no live AQI at all.
Winter Is When Indian AQI Peaks
Annual averages flatten the season that matters most. From October 1, 2025 to February 28, 2026, CPCB continuous-station data put Ghaziabad at an average of 172 µg/m³ of PM2.5, Noida at 166 and Delhi at 163. Greater Noida, Bahadurgarh, Dharuhera, Gurgaon, Bhiwadi, Charkhi Dadri and Baghpat filled the rest of the winter top 10. Every one of them is in the National Capital Region or right next to it.
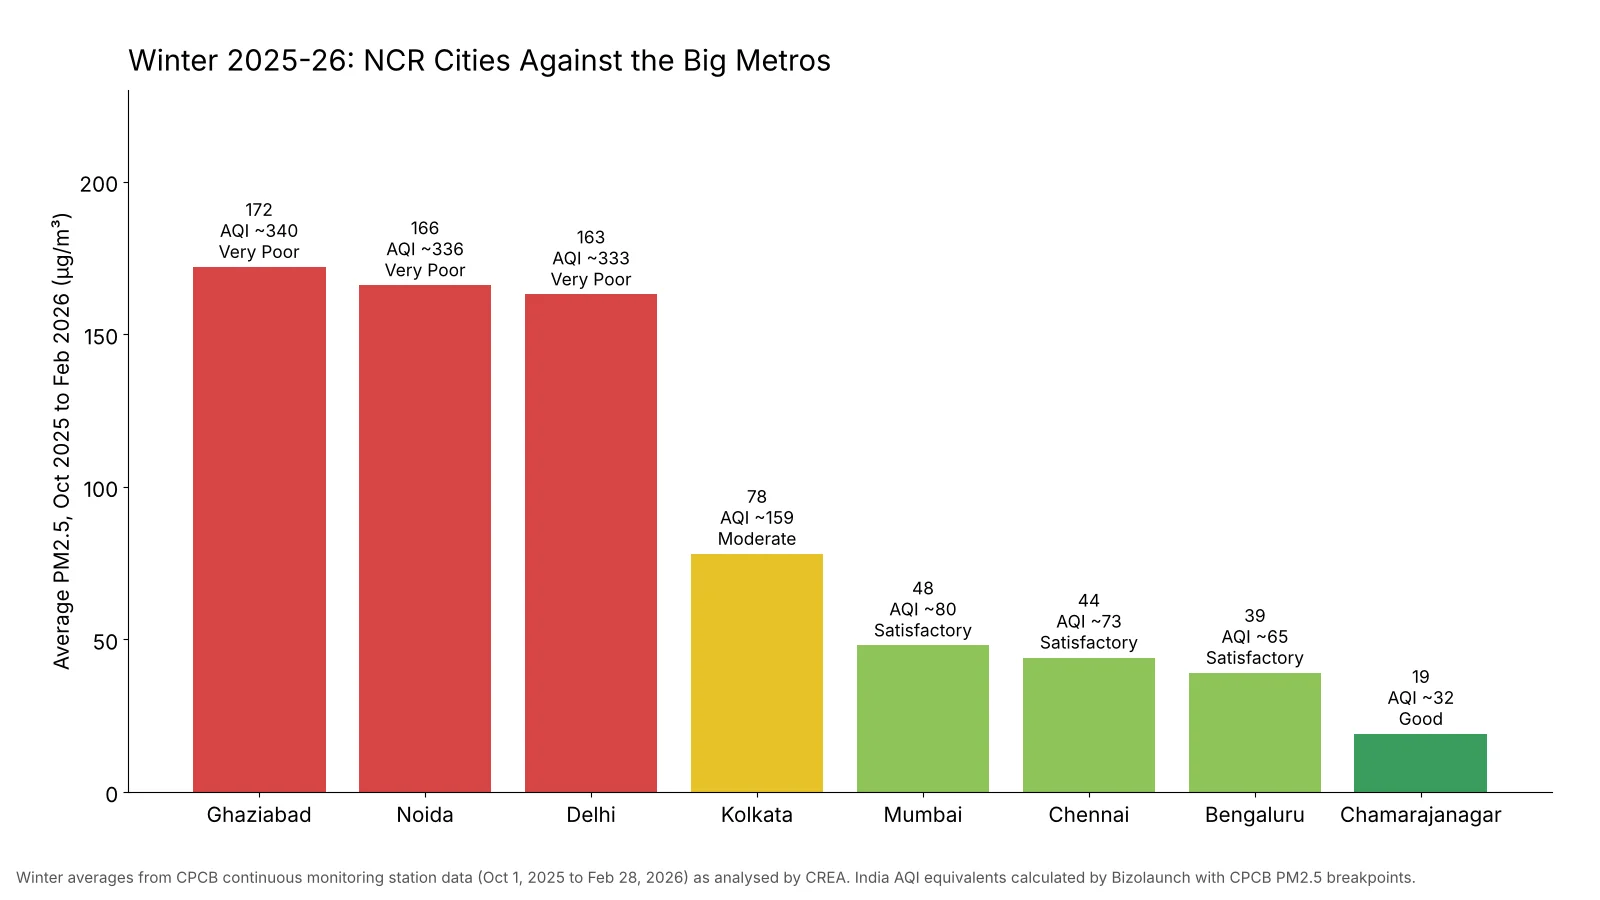
Converted to the index, the three NCR leaders averaged around 333 to 340 for five straight months, deep in “Very Poor”. Delhi alone had 18 “Severe” days and 87 “Very Poor” days that winter. In the same months, 204 of 238 cities with enough data breached the national PM2.5 standard, up from 173 the winter before.
Metro Cities Ranked by Winter PM2.5
| City | Winter 2025-26 average PM2.5 (µg/m³) | India AQI equivalent | Category | Multiple of the WHO annual guideline |
|---|---|---|---|---|
| Delhi | 163 | 333 | Very Poor | 32.6x |
| Kolkata | 78 | 159 | Moderate | 15.6x |
| Mumbai | 48 | 80 | Satisfactory | 9.6x |
| Chennai | 44 | 73 | Satisfactory | 8.8x |
| Bengaluru | 39 | 65 | Satisfactory | 7.8x |
| Chamarajanagar (cleanest city) | 19 | 32 | Good | 3.8x |
Mumbai, Chennai and Bengaluru sit in “Satisfactory” even in winter on India’s scale. On a US-scale app the same three cities read 110 to 132, “Unhealthy for Sensitive Groups”, which is why residents sometimes see alarming numbers on foreign apps. No Indian city met the WHO guideline of 5 µg/m³ in either of the last two winters.

Live CPCB Readings From the First Week of November 2026
The 24-hour CPCB figures for the morning of November 2, 2026 showed how quickly rankings change once winter sets in. Baghpat and Gajraula in Uttar Pradesh shared the highest AQI in the country at 358 out of 269 reporting cities. Delhi read 307 that morning and 331 the next.
| City | AQI, Nov 2, 2026 (7 am) | AQI, Nov 3, 2026 (7 am) | Category on Nov 3 |
|---|---|---|---|
| Delhi | 307 | 331 | Very Poor |
| Noida | 308 | 307 | Very Poor |
| Manesar | 214 | 302 | Very Poor |
| Gurugram | 225 | 284 | Poor |
| Ghaziabad | 276 | 259 | Poor |
| Greater Noida | 267 | 213 | Poor |
| Faridabad | 118 | 111 | Moderate |
Manesar jumped 88 points overnight while Greater Noida fell 54. Faridabad stayed “Moderate” while its neighbours were “Very Poor”. These swings are why a live map of your nearest station beats any annual list when you are planning a run, a school pickup or a site visit. Delhi’s response to these readings, Stage II of its Graded Response Action Plan, is explained in our guide on how much AQI is too much in Delhi.
Why the NCR Belt and Industrial Towns Dominate
Two kinds of places fill the table. The first is the National Capital Region and the western Uttar Pradesh towns around it: Loni, Delhi, Ghaziabad, Noida, Greater Noida, Gurugram, Bhiwadi, Hapur, Baghpat, Bulandshahr, Meerut and Muzaffarnagar. Twelve of the 14 NCR cities with enough 2025 data breached the national PM2.5 standard, and all 14 breached the PM10 standard. Across the Indo-Gangetic Plain, 47 of 61 cities breached it for PM2.5.
The second group is industrial towns: Byrnihat, Talcher, Angul, Singrauli, Mandideep, Baddi, Mandi Gobindgarh and Gummidipoondi. Their populations are small, but factory, mining or power-plant emissions push them into the national top 30. For coarse dust (PM10), Delhi led in 2025 at 197 µg/m³, followed by Ghaziabad at 190 and Greater Noida at 188. Of 229 cities with enough PM10 data, 190 breached the national standard.
| 2025 measure from CAAQMS data | Figure |
|---|---|
| Cities with 80%+ PM2.5 data | 231 |
| Cities breaching the PM2.5 standard | 103 (44.6%) |
| Cities with 80%+ PM10 data | 229 |
| Cities breaching the PM10 standard | 190 (83.0%) |
| Highest PM2.5 | Byrnihat 100, Delhi 96, Ghaziabad 93 |
| Highest PM10 | Delhi 197, Ghaziabad 190, Greater Noida 188 |
Where India’s Clean Air Money Has Gone
The National Clean Air Programme (NCAP) covers 130 cities. Under it and the Fifteenth Finance Commission grants, ₹13,415 crore has been released and ₹9,929 crore used, a utilisation rate of 74%. Road dust took 68% of the spending, transport 14%, and waste and biomass burning 12%. Monitoring and capacity building got 3%. Industry, household fuel and public outreach each got under 1%.
Results are mixed. Of the 102 NCAP cities with continuous monitors, 51 met the first target of a 20% to 30% cut in PM10, and 23 met the revised 40% target. Another 23 cities saw PM10 rise. Twenty-eight NCAP cities still have no continuous monitor at all. Given that industrial towns like Byrnihat and Talcher top the PM2.5 list, the under-1% share for industry is the gap most likely to be questioned in the next review.
| NCAP spending head | Share of funds used | Approximate amount (our calculation, ₹ crore) |
|---|---|---|
| Road dust | 68% | 6,752 |
| Transport | 14% | 1,390 |
| Waste management and biomass burning | 12% | 1,191 |
| Capacity building and monitoring | 3% | 298 |
| Industry, domestic fuel, public outreach | Under 1% each | Under 99 each |
We applied each published share to the ₹9,929 crore used. Readers who want to rerun the split with other totals can use our percentage calculator.
Living and Working in a High-AQI Indian City
For people who live in the NCR belt, the data points to a few habits. Track your nearest CPCB station, since the city average can hide a 250-point spread between stations. Avoid hard outdoor exercise in the early morning and evening, the hours the national health handbook on air pollution flags for bad days. Keep indoor air cleaner by avoiding incense, mosquito coils, candles and wood or coal fires, all of which the same handbook lists as indoor sources to cut.
Air purifiers only work while they have power, so homes with frequent cuts should size their backup. Our guide on calculating inverter battery backup time shows the math for a purifier’s wattage. Commuters can cut their exposure and their emissions by using metro and bus services where they exist; our list of cities with free public transportation shows how other places have pushed people out of cars.
Quick Answers on India’s Highest AQI Cities
Which Is the Most Polluted City in India?
On CPCB’s continuous network, Byrnihat had the highest 2025 PM2.5 at 100 µg/m³, ahead of Delhi at 96. A wider dataset that includes more monitors puts Loni, near Ghaziabad, first at 112.5.
Which Indian City Has the Cleanest Air?
In winter 2025-26, Chamarajanagar in Karnataka had the lowest average PM2.5 among cities with enough data, at 19 µg/m³. That is “Good” on India’s index, though still almost four times the WHO guideline.
Is Mumbai’s Air Better Than Delhi’s?
Yes, by a wide margin. Mumbai averaged 48 µg/m³ of PM2.5 over winter 2025-26, against 163 for Delhi. That puts Mumbai in “Satisfactory” and Delhi in “Very Poor” on India’s index.
CPCB-Based Reports and Monitoring Pages Used
Annual and winter figures rest on CPCB Continuous Ambient Air Quality Monitoring Station data. The 29-city table uses the 2025 city ranking listed below. All percentage changes, AQI conversions and rupee splits are Bizolaunch calculations.
- CREA: Tracing the Hazy Air 2026, progress report on NCAP (CAAQMS data for 2025)
- The Wire: Winter pollution across India in 2025-26 (CPCB CAAQMS data analysed by CREA)
- The Shillong Times: Byrnihat becomes India’s most polluted urban centre again
- IQAir: Most polluted cities, 2025 and 2024 annual PM2.5
- Indian Economic Service Arthapedia: National Air Quality Index breakpoints and health impacts
- Business Standard: Delhi AQI at 307 as new winter curbs begin (November 2, 2026)
- Business Standard: Delhi AQI climbs to 331, GRAP II enforced (November 3, 2026)
- National Centre for Disease Control: Handbook for ASHAs on Air Pollution and Its Impact on Health