


The 40 Cities With the Highest AQI Levels in 2025
Loni, a town on Delhi’s north-eastern edge in Uttar Pradesh, had the dirtiest air of any monitored city in the world in 2025. Its annual average PM2.5 was 112.5 micrograms per cubic metre (µg/m³). On the US AQI scale that works out to about 191, inside the “Unhealthy” band, and Loni stayed at that level as an average across the whole year. Hotan in western China came second at 109.6, Byrnihat in northeast India was third at 101.1, and Delhi was fourth at 99.6.
We ranked cities by their 2025 annual average of PM2.5, the fine dust that drives most AQI readings. A yearly average is a fairer test than one bad morning, because Delhi can post a “severe” reading in November and a “satisfactory” one in August, and only the full-year number shows what residents actually breathe over time. Each city then got two AQI equivalents that we worked out ourselves, one on the US scale and one on India’s scale.
| Rank | City | Country | PM2.5, 2025 (µg/m³) | Times WHO guideline | US AQI equivalent | India AQI equivalent |
|---|---|---|---|---|---|---|
| 1 | Loni | India | 112.5 | 22.5x | 191 | 274 (Poor) |
| 2 | Hotan | China | 109.6 | 21.9x | 189 | 264 (Poor) |
| 3 | Byrnihat | India | 101.1 | 20.2x | 183 | 235 (Poor) |
| 4 | Delhi | India | 99.6 | 19.9x | 182 | 230 (Poor) |
| 5 | Faisalabad | Pakistan | 98.8 | 19.8x | 181 | 228 (Poor) |
| 6 | Rahim Yar Khan | Pakistan | 92.6 | 18.5x | 177 | 206 (Poor) |
| 7 | Ghaziabad | India | 89.2 | 17.8x | 175 | 197 (Moderate) |
| 8 | Lahore | Pakistan | 88.9 | 17.8x | 174 | 196 (Moderate) |
| 9 | Sukkur | Pakistan | 88.6 | 17.7x | 174 | 195 (Moderate) |
| 10 | Ula | India | 86.8 | 17.4x | 173 | 189 (Moderate) |
| 11 | Pattoki | Pakistan | 86.7 | 17.3x | 173 | 189 (Moderate) |
| 12 | Mullanpur Dhaka | India | 86.2 | 17.2x | 173 | 187 (Moderate) |
| 13 | Lodhran | Pakistan | 85.3 | 17.1x | 172 | 184 (Moderate) |
| 14 | Kashgar | China | 84.0 | 16.8x | 171 | 180 (Moderate) |
| 15 | Madhyamgram | India | 83.3 | 16.7x | 170 | 177 (Moderate) |
| 16 | New Delhi | India | 82.2 | 16.4x | 170 | 173 (Moderate) |
| 17 | Peshawar | Pakistan | 81.7 | 16.3x | 169 | 172 (Moderate) |
| 18 | Noida | India | 80.5 | 16.1x | 169 | 168 (Moderate) |
| 19 | Kizilsu | China | 79.7 | 15.9x | 168 | 165 (Moderate) |
| 20 | Sialkot | Pakistan | 78.6 | 15.7x | 167 | 161 (Moderate) |
| 21 | Greater Noida | India | 77.2 | 15.4x | 166 | 156 (Moderate) |
| 22 | Aksu | China | 74.9 | 15.0x | 165 | 148 (Moderate) |
| 23 | Gurugram | India | 74.6 | 14.9x | 164 | 147 (Moderate) |
| 24 | Mandi Bahauddin | Pakistan | 74.4 | 14.9x | 164 | 147 (Moderate) |
| 25 | Bhiwadi | India | 74.1 | 14.8x | 164 | 146 (Moderate) |
| 26 | Karaganda | Kazakhstan | 72.6 | 14.5x | 163 | 141 (Moderate) |
| 27 | Hajipur | India | 71.5 | 14.3x | 162 | 137 (Moderate) |
| 28 | Multan | Pakistan | 71.1 | 14.2x | 162 | 135 (Moderate) |
| 29 | Muzaffarnagar | India | 69.1 | 13.8x | 161 | 129 (Moderate) |
| 30 | Fergana | Uzbekistan | 68.8 | 13.8x | 160 | 128 (Moderate) |
| 31 | Talcher | India | 68.1 | 13.6x | 160 | 125 (Moderate) |
| 32 | Dhaka | Bangladesh | 68.0 | 13.6x | 160 | 125 (Moderate) |
| 33 | Bahawalpur | Pakistan | 67.7 | 13.5x | 160 | 124 (Moderate) |
| 34 | Hapur | India | 67.6 | 13.5x | 159 | 124 (Moderate) |
| 35 | Baghpat | India | 65.8 | 13.2x | 158 | 117 (Moderate) |
| 36 | Bulandshahr | India | 64.5 | 12.9x | 157 | 113 (Moderate) |
| 37 | Igdir | Turkey | 64.4 | 12.9x | 157 | 113 (Moderate) |
| 38 | Jhang | Pakistan | 63.6 | 12.7x | 157 | 110 (Moderate) |
| 39 | Mandideep | India | 63.0 | 12.6x | 156 | 108 (Moderate) |
| 40 | Singrauli | India | 62.9 | 12.6x | 156 | 107 (Moderate) |
Every city on the list lands in the US “Unhealthy” band (151 to 200) as a yearly average, and the average of the top 40 was 79.5 µg/m³. For the top 10 it was 96.8 µg/m³, close to 20 times the World Health Organization’s annual guideline of 5 µg/m³.

The AQI columns are our own conversion, made by plugging each city’s yearly PM2.5 into the official breakpoint formula for each country. Real AQI is reported for 24-hour or hourly periods, so treat these columns as a guide to what an average day in that city would look like.
Why One City Gets Two Different AQI Numbers
Delhi’s 2025 average of 99.6 µg/m³ reads as 182 on a US app and 230 on India’s national index. The gap confuses travellers, expatriates and anyone comparing cities on different apps, and it comes entirely from where each country draws its category lines.
US EPA Scale After the 2024 Update
The US Environmental Protection Agency changed its PM2.5 breakpoints in February 2024, and the new scale went live on May 6, 2024. “Good” now ends at 9.0 µg/m³, down from 12.0, to match the stricter annual standard of 9.0. The “Unhealthy” band now tops out at 125.4, and anything above 225.4 counts as “Hazardous”. The US scale is therefore strict at the low end, and a city averaging 25 µg/m³ is already “Moderate” with an AQI of about 81.
India’s National Air Quality Index
India’s index, launched on October 17, 2014, covers eight pollutants. For PM2.5 it calls 0 to 30 µg/m³ “Good” and 31 to 60 “Satisfactory”. A 24-hour average of 60 µg/m³ is “Satisfactory” in India and “Unhealthy” in the United States, but the Indian scale climbs much faster at higher concentrations. Its “Very Poor” band starts at 121 µg/m³ and runs to 250, and “Severe” begins above 250.
| PM2.5, 24-hour (µg/m³) | US AQI | US category | India AQI | India category |
|---|---|---|---|---|
| 5 (WHO annual guideline) | 28 | Good | 8 | Good |
| 9 | 50 | Good | 15 | Good |
| 25 | 81 | Moderate | 42 | Good |
| 35 | 99 | Moderate | 58 | Satisfactory |
| 60 | 154 | Unhealthy | 100 | Satisfactory |
| 99.6 (Delhi 2025 average) | 182 | Unhealthy | 230 | Poor |
| 163 | 238 | Very Unhealthy | 333 | Very Poor |
| 200 | 275 | Very Unhealthy | 362 | Very Poor |
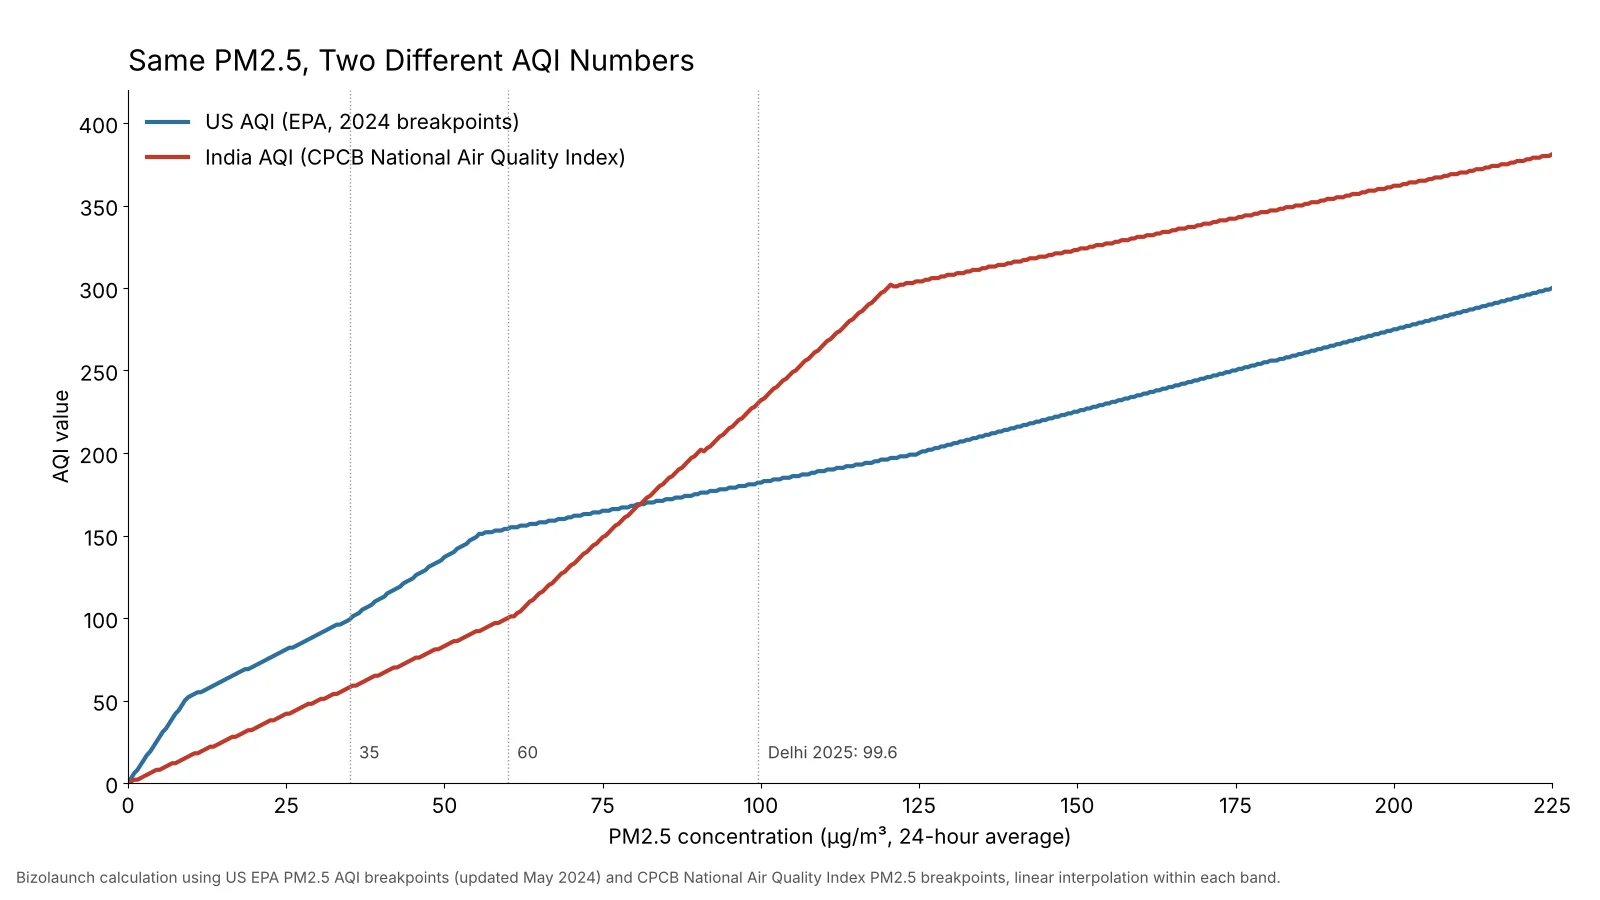
The two lines cross at about 81 µg/m³. Below that point a US app shows the bigger number, and above it India’s index does, so compare cities on one scale only. If you mix a US-scale reading from one app with an Indian-scale reading from another, the ranking can flip.
South Asia and Xinjiang Fill the Top of the List
Of the 40 cities in our table, 20 are in India and 12 in Pakistan. Four are in China, and all four (Hotan, Kashgar, Kizilsu and Aksu) are in Xinjiang, around the Taklamakan Desert. Kazakhstan, Uzbekistan, Bangladesh and Turkey have one city each. No city in Europe, Africa or the Americas reaches the top 40.
| Country | Cities in the top 40 | Highest-ranked city | National average PM2.5, 2025 (µg/m³) |
|---|---|---|---|
| India | 20 | Loni (1st) | Not published as one figure |
| Pakistan | 12 | Faisalabad (5th) | 67.3 (most polluted country) |
| China | 4 | Hotan (2nd) | Not in the top five |
| Bangladesh | 1 | Dhaka (32nd) | 66.1 (second) |
| Kazakhstan | 1 | Karaganda (26th) | Not in the top five |
| Uzbekistan | 1 | Fergana (30th) | Not in the top five |
| Turkey | 1 | Igdir (37th) | Not in the top five |
Country rankings follow a different pattern from city rankings. Pakistan had the highest national average in 2025 at 67.3 µg/m³. Bangladesh followed at 66.1, then Tajikistan at 57.3, Chad at 53.6 and the Democratic Republic of the Congo at 50.2. Chad and Congo have few monitors, so they rarely show up in city tables even with dirty national air.

Big Cities With the Worst Air Compared With Small Towns
Most names in the top 40 are small industrial towns or satellite cities, and places such as Loni, Byrnihat, Ula and Pattoki are not household names outside their regions. People searching for the “most polluted city” usually mean large cities, so we pulled out the five major cities with the worst 2025 averages and set them against earlier years.
| Major city | PM2.5, 2025 | PM2.5, 2024 | Change (our calculation) | US AQI equivalent, 2025 |
|---|---|---|---|---|
| Delhi, India | 99.6 | 108.3 | -8.0% | 182 |
| Lahore, Pakistan | 88.9 | 102.1 | -12.9% | 174 |
| Dhaka, Bangladesh | 68.0 | 78.0 | -12.8% | 160 |
| Kolkata, India | 51.0 | Below 51 (2025 was its worst year since 2021, when it hit 59) | Rose | 139 |
| Kinshasa, DR Congo | 50.2 | No earlier figure | No comparison | 137 |
Delhi, Lahore and Dhaka all improved on 2024, yet each still sits deep in the US “Unhealthy” band. Kolkata went the other way. You can check any of these year-on-year changes with our percentage change calculator. Its 2025 average was its worst since 2021, and it took Karachi’s place in the top five. Loni, the overall leader, rose by about 23% from 91.7 µg/m³ in 2024.
For Indian cities in detail, including winter averages and live CPCB readings, see our ranking of the highest AQI cities in India.
How Monitoring Networks Can Disagree on the Same City
A city’s rank depends on which stations feed its average. India’s own continuous monitoring network (CAAQMS) gave these 2025 PM2.5 averages for the three worst cities in the country. We set them next to the global dataset used in our table.
| City | India’s CAAQMS network, 2025 | Global dataset, 2025 | Gap |
|---|---|---|---|
| Byrnihat | 100 | 101.1 | +1.1 |
| Delhi | 96 | 99.6 | +3.6 |
| Ghaziabad | 93 | 89.2 | -3.8 |
The figures agree within about 4%, but the order of the cities changes. On India’s network, Byrnihat ranks first in the country. Loni, which tops the global list, does not appear in the national top three because the two datasets draw on different station sets. Ghaziabad is higher on the national network than in the global data. Any single “most polluted city” headline depends on which network is used.
Where Air Meets the WHO Guideline
The 2025 dataset covered 9,446 cities in 143 countries, regions and territories. Just 14% of those cities met the WHO annual guideline of 5 µg/m³, down from 17% a year earlier. Thirteen countries and territories met it, including Australia, Estonia and Iceland. The cleanest city in the whole dataset was Nieuwoudtville, a small town in South Africa’s Northern Cape, at 1.0 µg/m³.
For a US reference point, the national average rose to 7.3 µg/m³. El Paso, Texas, was the most polluted major US city at 11.4, up 46%. Seattle was the cleanest major US city at 4.5, which means Loni’s air carried 25 times Seattle’s fine-particle load across the year. Readers comparing places to live or work remotely can weigh this next to our guides to the best European cities for digital nomads and countries offering digital nomad visas.
| Reference point | PM2.5 (µg/m³) | US AQI equivalent |
|---|---|---|
| Nieuwoudtville, South Africa (cleanest city) | 1.0 | 6 |
| Seattle, US (cleanest major US city) | 4.5 | 25 |
| WHO annual guideline | 5.0 | 28 |
| US national average | 7.3 | 41 |
| El Paso, US (most polluted major US city) | 11.4 | 55 |
| Loni, India (most polluted city) | 112.5 | 191 |
Reading a Live AQI Number on a Bad Day
Annual averages hide the spikes that make headlines, and Delhi shows the difference well. Its 2025 average converts to roughly 230 on India’s index, while its 24-hour AQI reached 331 on the morning of November 3, 2026. Eight of the city’s 58 reporting stations crossed 400 that day, with Jahangirpuri at 449. Stage II of the city’s pollution plan had come into force the day before. Our guide to what Delhi AQI levels mean for health covers those stages.
Four habits make live readings far more useful when you are deciding whether to exercise outdoors, open windows or send children to play:
- Check which scale the app uses. A US-scale app will show bigger numbers than India’s index at ordinary pollution levels and smaller ones on very bad days.
- Look at the averaging period. An hourly figure can jump 100 points in an evening. A 24-hour figure is what official categories are built on.
- Find the nearest station. Delhi’s stations ranged from 195 to 449 on the same morning, so a city-wide number can be far from what your street gets.
- Plan the commute around the reading. Traffic is a large local source, and cities that have cut fares to get people out of cars are listed in our guide to cities with free public transportation.
Questions People Ask About the World’s Most Polluted Cities
Which City Has the Highest AQI in the World?
Loni in Uttar Pradesh, India, had the highest annual PM2.5 in 2025 at 112.5 µg/m³, which is about 191 on the US AQI scale. Among large cities with millions of residents, Delhi ranked worst at 99.6 µg/m³, ahead of Lahore and Dhaka.
Which Country Has the Worst Air Quality?
Pakistan had the highest national average in 2025 at 67.3 µg/m³, followed by Bangladesh at 66.1 and Tajikistan at 57.3, with Chad and the Democratic Republic of the Congo completing the top five.
What AQI Is Considered Dangerous?
On the US scale, 151 to 200 is “Unhealthy” for everyone, 201 to 300 is “Very Unhealthy” and 301 and up is “Hazardous”. On India’s index, 201 to 300 is “Poor”, 301 to 400 “Very Poor” and 401 to 500 “Severe”.
Why Do Indian Apps Show a Different AQI From US Apps?
They use different breakpoints for the same pollutant, so at 60 µg/m³ of PM2.5 India’s index reads 100 while the US scale reads 154. Above roughly 81 µg/m³ the Indian number becomes the higher one.
Monitoring Data and Standards Behind This Ranking
City PM2.5 values come from the 2025 annual city ranking listed first below. The table ranking, country counts, percentage changes, WHO multiples and both AQI conversions are Bizolaunch calculations.
- IQAir: World’s most polluted cities, 2025 ranking
- IQAir: 2025 World Air Quality Report press release (March 24, 2026)
- IQAir: Five most polluted major cities in 2025
- US EPA: Air Quality Index fact sheet for the 2024 PM standard
- Indian Economic Service Arthapedia: National Air Quality Index
- CREA: Tracing the Hazy Air 2026, NCAP progress report (CAAQMS data for 2025)
- Business Standard: Delhi AQI climbs to 331, GRAP II curbs enforced (November 3, 2026)