

Buying a home beats renting once your equity outgrows the cash you sink into the purchase. Renting wins when you may move within a few years, or when the monthly cost of owning runs far above your rent. So the answer turns on how long you will stay. After that, it depends on the cash you need at closing and the true monthly cost of owning.
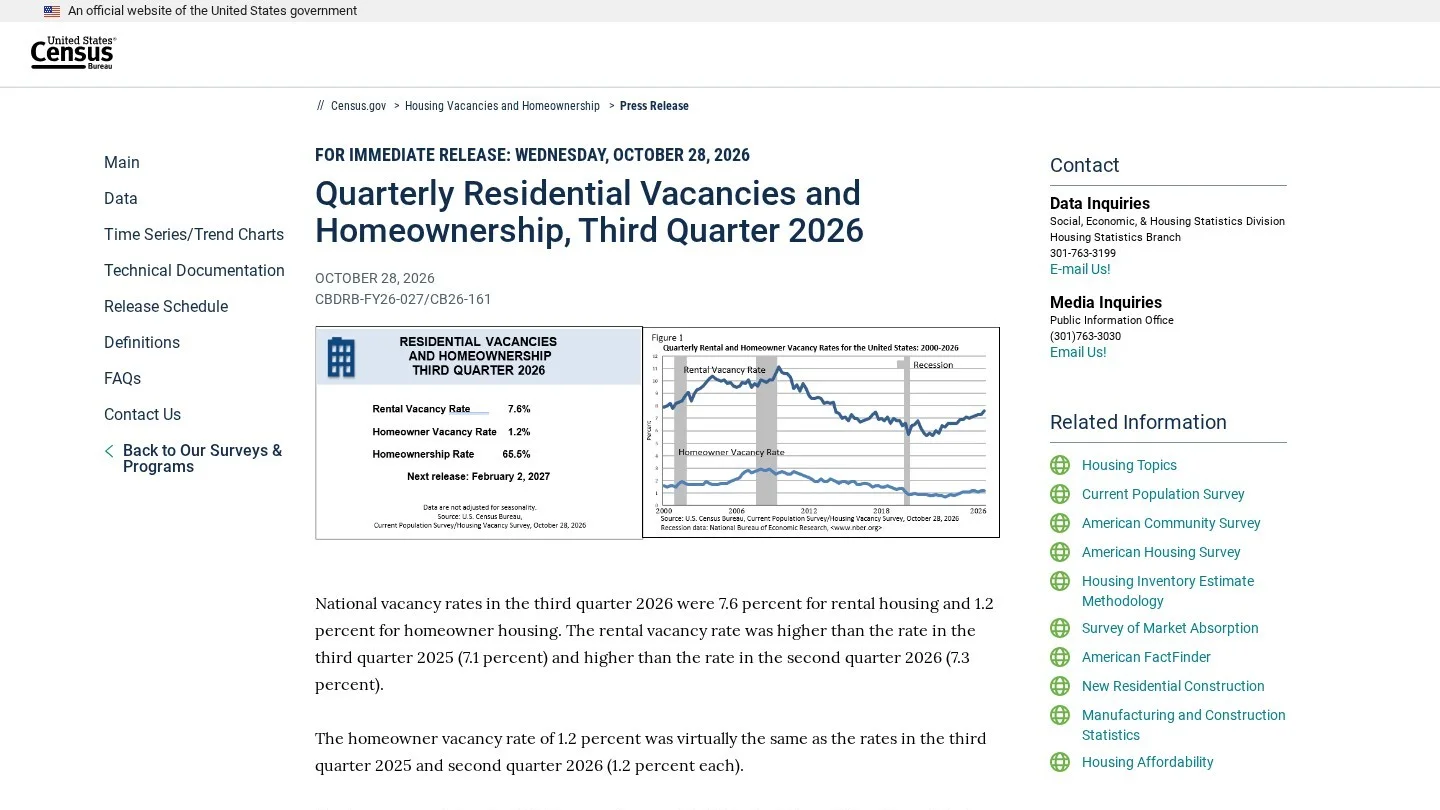
The latest housing data shows why the question is so live right now. On October 28, 2026, the Census Bureau reported a homeownership rate of 65.5% for the third quarter. That was close to the 65.3% of a year earlier. However, the rental vacancy rate rose to 7.6%, from 7.1% a year before. For households under 35, the ownership rate was 36.6%, down 0.9 points from a year earlier.
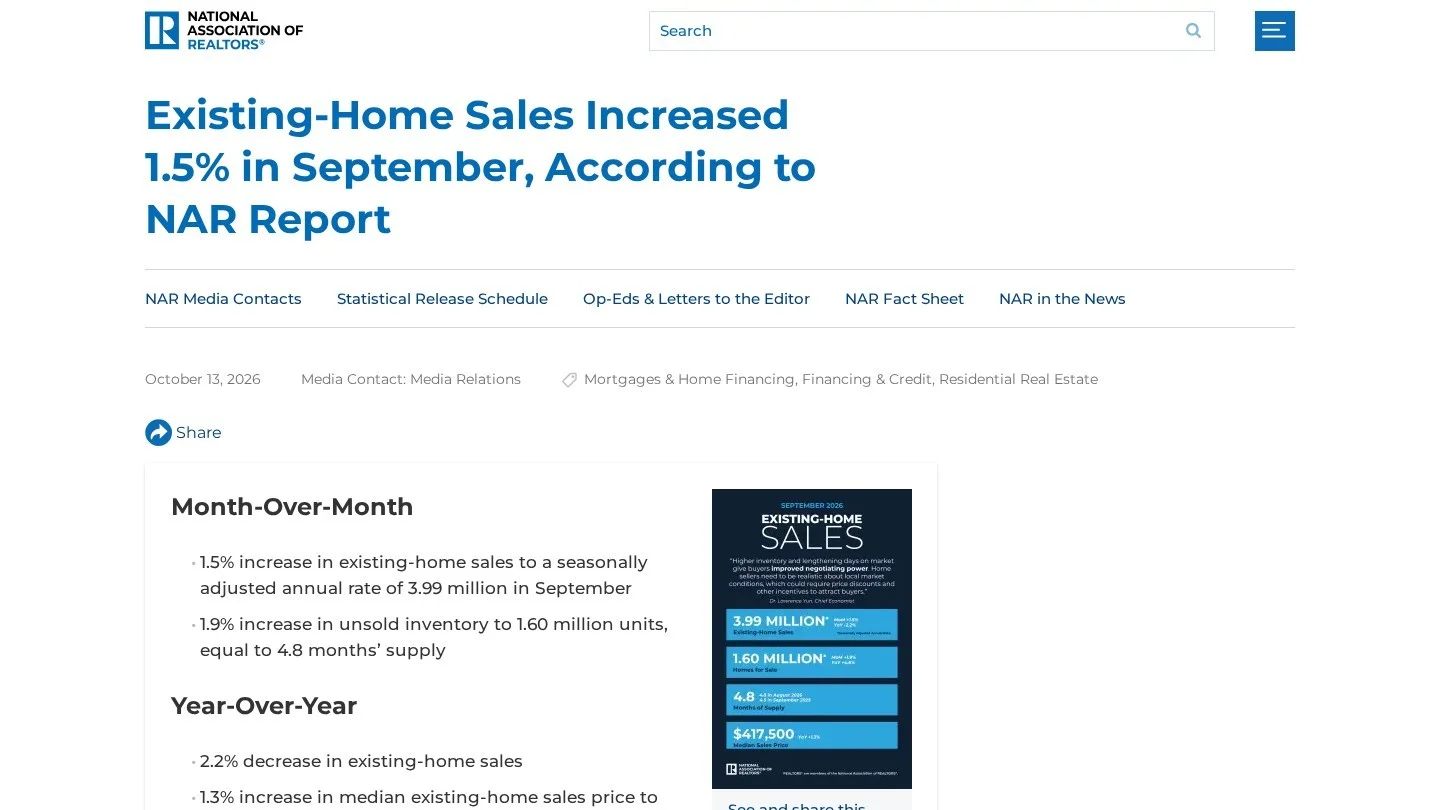
Prices and rates set the other side of the math. On October 13, 2026, the National Association of Realtors put the September median existing-home price at $417,500, up 1.3% from a year earlier. Then on November 5, Freddie Mac’s weekly survey showed the 30-year fixed rate at 7.18%. A year earlier it was 6.22%.
We compiled those official figures and built our own worked example around them. Every calculation shows its inputs, so you can swap in your own rent, price and rate.
Add Up the Cash You Need on Closing Day
Buying takes two piles of cash, the down payment and the closing costs. Fannie Mae says closing costs usually run from 2% to 5% of the mortgage amount, paid on top of the down payment. They cover lender fees, title and settlement charges, third-party fees, and taxes and government fees.
Next, we applied that range to the $417,500 national median price at three down payment levels. For each row, the down payment is the price times the percentage. The loan is the rest of the price, and closing costs are 2% and 5% of that loan.
| Down payment | Down payment in dollars | Loan amount | Closing costs (2% to 5% of loan) | Cash needed at closing |
|---|---|---|---|---|
| 5% | $20,875 | $396,625 | $7,932 to $19,831 | $28,807 to $40,706 |
| 10% | $41,750 | $375,750 | $7,515 to $18,788 | $49,265 to $60,538 |
| 20% | $83,500 | $334,000 | $6,680 to $16,700 | $90,180 to $100,200 |
Then compare those totals with what a landlord asks at move-in. That gap in up-front cash is the first cost of buying. Money tied up in a house cannot sit in savings or investments, so count what that cash would earn elsewhere too.
Price the Full Monthly Cost of Owning
The mortgage payment is the number most people compare with rent. But it is only part of the bill. We worked out principal and interest with the standard loan formula, using a 30-year term at 7.18%.
| Down payment | Loan amount | Monthly principal and interest at 7.18% |
|---|---|---|
| 5% | $396,625 | $2,686.88 |
| 10% | $375,750 | $2,545.46 |
| 20% | $334,000 | $2,262.63 |
Rates move this figure a lot. For example, the same 20% down on last year’s median price of $412,300 at 6.22% gave a payment of $2,024.45. So a buyer at today’s median pays about $238 more each month than a year ago, even though the price rose only 1.3%. You can test other rates and terms with our loan EMI calculation guide, since a mortgage uses the same formula.
After that, add the costs a landlord covers while you rent. Each one belongs in your monthly total.
- Property tax, which you can find on the county record for the home you want.
- Homeowners insurance, from quotes for that address.
- HOA or condo fees, if the home has them.
- Private mortgage insurance, which lenders usually require when the down payment is under 20% of the price.
- Repairs and upkeep, from roofs and water heaters to lawn care.
- Utilities a landlord may have covered, such as water or trash.
For a feel for one of those bills, our list of the average electricity bill by state shows how much power costs vary. Add each item to the principal and interest. That total is the number to compare with your rent.
Separate Equity From Interest in Every Payment
Part of each mortgage payment builds equity, and part is interest you never get back. In the early years, most of it is interest. That split decides how fast owning catches up with renting.
We ran the full amortization for the $334,000 loan at 7.18%. After five years, the buyer has paid $135,758 in principal and interest. Of that, only $19,003 went to principal. The other $116,755 was interest. By year 10, principal paid reaches $46,185, while interest reaches $225,331.
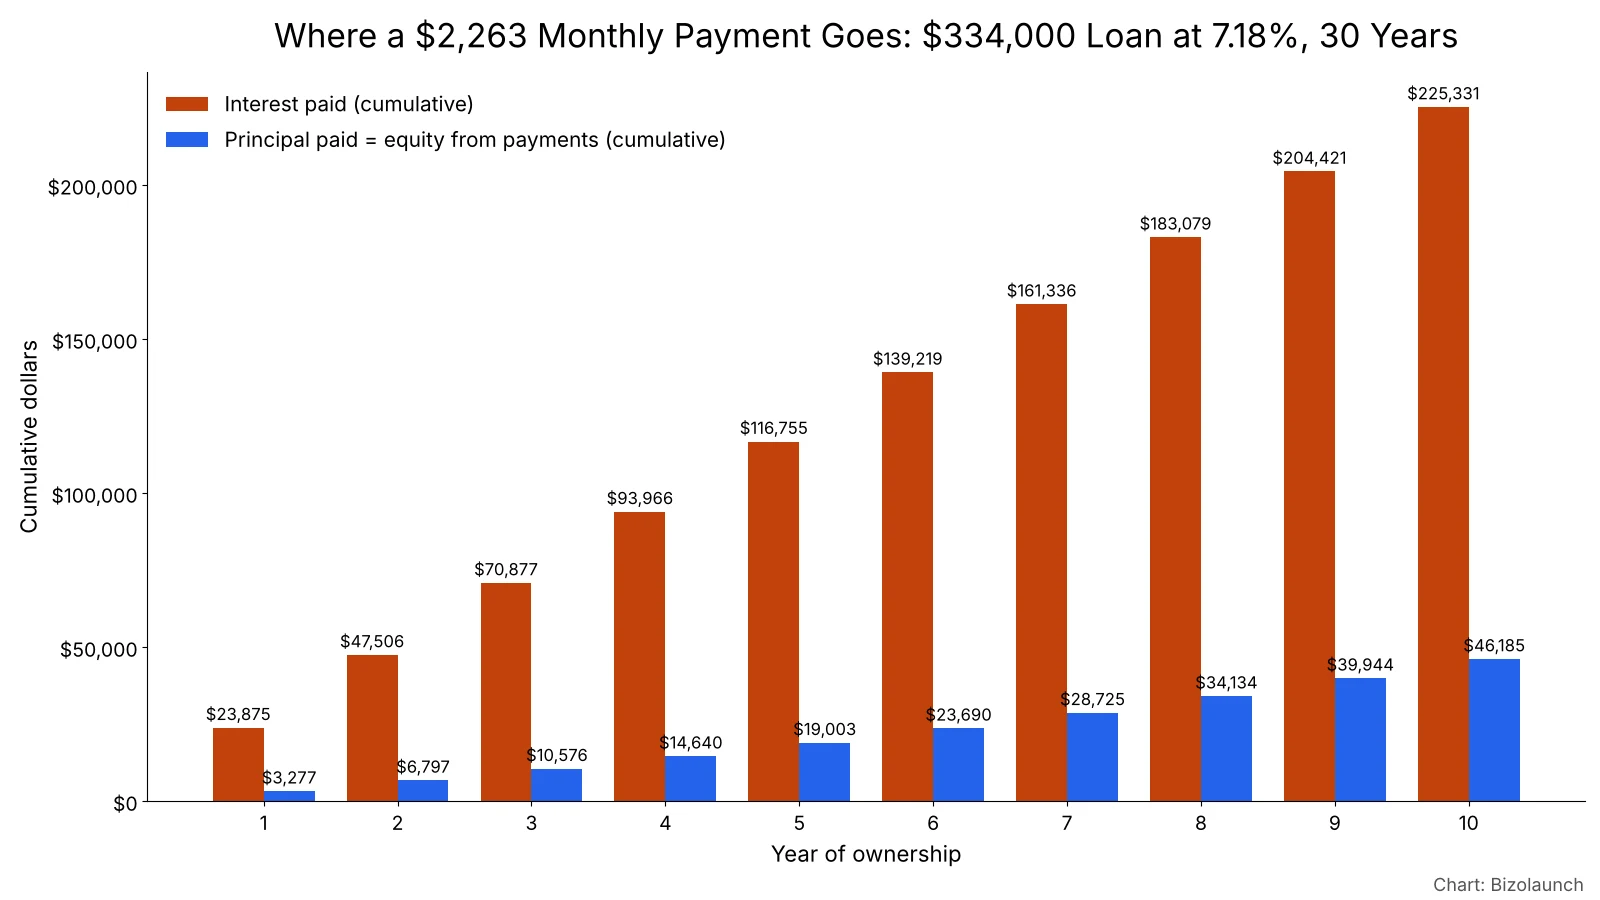
| Years owned | Principal paid (equity from payments) | Interest paid |
|---|---|---|
| 1 | $3,277 | $23,875 |
| 3 | $10,578 | $70,877 |
| 5 | $19,003 | $116,755 |
| 10 | $46,185 | $225,331 |
So equity from payments alone grows slowly at today’s rates. In fact, a buyer who sells after three years would have $10,578 of new equity from payments. Closing costs alone were $6,680 to $16,700. Price growth can change that picture, in either direction. Still, it explains why short stays seldom favor buying.
Read the Rental Market Before You Sign Anything
The 7.6% rental vacancy rate tells renters something useful. More empty units means more landlords competing for tenants. In that setting, asking about a lower rent, a free month or a longer lease at a fixed price is a fair move.
Buyers can read the market too. NAR counted 1.60 million homes for sale in September, equal to 4.8 months of supply. That was up from 4.5 months a year earlier. Homes also took a median of 33 days to sell. As a result, buyers have a little more choice and time than they did a year ago.
Local numbers matter more than national ones, though. The September median was $613,600 in the West and $329,600 in the Midwest. So a rent that looks cheap next to the national median can look expensive in a lower-priced region. Pull prices and rents for your own zip code before you decide.
Find the Year When Buying Pulls Ahead
The break-even year is the point where owning has cost you less than renting would have. We use a five-step method that works with any local numbers.
- Add the cash spent to buy: closing costs, plus any repairs or furniture you need at move-in.
- Each year, add up the costs of owning that you never get back: interest, property tax, insurance, HOA, mortgage insurance and upkeep.
- Each year, add up the rent you would have paid, plus renters insurance.
- Add the costs of selling at the end, such as agent fees and transfer taxes where they apply.
- Compare the totals year by year, and count any price growth as a gain for the owner.
The year when owning’s total drops under renting’s total is your break-even point. If you expect to move before then, renting is usually the cheaper choice. Our percentage calculator handles the closing cost and price growth steps quickly.
Take note of the cash side too. A renter who keeps the $90,180 or more a buyer would spend at 20% down can save or invest it. Any return on that money counts in favor of renting. So include it, using a rate you could actually earn.
Check Your Own Situation Against This List
We turned the numbers into a checklist. Answer each line for your own city and job, not the national figures.
- You expect to stay at least as long as your break-even year.
- You can pay the down payment and closing costs and still keep an emergency fund.
- The full monthly cost of owning fits your budget, not just the mortgage payment.
- Your income is steady enough to carry a fixed payment for years.
- You have priced local taxes, insurance and HOA fees for the exact homes you want.
- You have compared that total with the rent for a similar home in the same area.
- You have a plan if rates fall, such as refinancing once the savings beat the new closing costs.
If most lines are a yes, buying may make sense. If several are a no, renting keeps your cash free and your options open. Some people also look at other ways into property. For example, our guide on starting a property management business covers the work side of rentals.
Questions Buyers and Renters Ask About Timing
Is it cheaper to rent or buy a house?
It depends on your local prices and how long you will stay. At the national median price and a 7.18% rate, principal and interest alone are $2,262.63 a month with 20% down. Add taxes, insurance and upkeep, then compare that total with your rent.
How long should you stay in a home before buying makes sense?
Long enough to pass your break-even year. In our example, five years of payments built $19,003 in equity from principal. Short stays often fail to cover the closing costs and the costs of selling.
Should I wait for mortgage rates to fall before buying?
No one can time rates with certainty. Rates were 6.22% a year before the November 5 reading of 7.18%. If you buy at a higher rate, you can refinance later, but that brings new closing costs. So buy when the payment works today.
What is the homeownership rate in the US?
The Census Bureau put it at 65.5% for the third quarter of 2026. For households under 35, the rate was 36.6%. Our list of average home sizes by country adds context on how much space those homes provide around the world.