


Middlesbrough has the highest crime rate of any major city or large town in England and Wales, with 153.7 police recorded crimes per 1,000 residents in the year ending June 2026. Manchester has the highest rate of any place with official city status, at 143.0 per 1,000. Both are far above the England and Wales average of 84.6, according to the latest Office for National Statistics (ONS) police force area data tables.
At the other end of the scale, Winchester recorded 56.8 crimes per 1,000 people, and St Albans, York, Chelmsford and Swansea also sit well below the national rate. This guide ranks 48 cities and large towns, shows which crime types drive each result, and explains why some figures look worse than daily life feels. It covers England and Wales in detail, plus Scotland’s headline figures.
Middlesbrough Highest, Winchester Lowest Among 48 Places
- Middlesbrough had the highest rate in our table at 153.7 crimes per 1,000 residents. By our calculation, that is about 82% above the England and Wales average of 84.6.
- Manchester (143.0) had the highest rate of any official city, while Winchester (56.8) had the lowest of the 48 places we ranked.
- Of the 48 cities and large towns in the table, 41 have a crime rate above the England and Wales average.
- London’s police force area recorded 101.0 crimes per 1,000 residents, but central boroughs such as Westminster (342.1) look extreme because ONS rates count residents only, not workers and visitors.
- Scotland recorded 569 crimes per 10,000 people in 2025-26 under its own counting rules, so its figures should not be lined up directly against English and Welsh ones.
Crime Rate by City in the UK: Full Ranking Table
The table below ranks every city and large town in the ONS release that we could compare fairly. Each row is a local council area, so “Leeds” means the whole City of Leeds district, suburbs included, rather than only the city center. The rate is police recorded crime per 1,000 residents, excluding fraud, for July 2025 to June 2026.
We also show three of the biggest crime groups. Violence against the person covers everything from assault to harassment and stalking. Theft includes shoplifting, vehicle crime and theft from the person. Residential burglary means a break-in at a home or its outbuildings, such as a garage or shed.
| Rank | City or Town | Police Force | Population (Mid-2024) | Total Crime Rate | Violence Against the Person | Theft | Residential Burglary |
|---|---|---|---|---|---|---|---|
| 1 | Middlesbrough | Cleveland | 156,200 | 153.7 | 54.2 | 41.8 | 4.6 |
| 2 | Blackpool | Lancashire | 144,200 | 145.5 | 69.4 | 32.6 | 2.9 |
| 3 | Manchester | Greater Manchester | 589,700 | 143.0 | 51.8 | 39.4 | 3.3 |
| 4 | Hartlepool | Cleveland | 98,200 | 136.7 | 47.8 | 42.6 | 4.8 |
| 5 | Nottingham | Nottinghamshire | 331,100 | 128.2 | 43.1 | 43.6 | 3.1 |
| 6 | Bristol | Avon and Somerset | 494,400 | 127.6 | 46.5 | 42.3 | 3.6 |
| 7 | Liverpool | Merseyside | 509,000 | 123.0 | 45.4 | 29.4 | 2.3 |
| 8 | Southampton | Hampshire | 259,400 | 121.0 | 44.6 | 38.0 | 3.6 |
| 9 | Hull | Humberside | 275,400 | 119.6 | 48.4 | 33.9 | 5.2 |
| 10 | Lincoln | Lincolnshire | 105,100 | 117.9 | 44.5 | 37.6 | 2.3 |
| 11 | Doncaster | South Yorkshire | 319,800 | 116.7 | 43.2 | 36.7 | 4.3 |
| 12 | Bradford | West Yorkshire | 563,600 | 116.0 | 50.2 | 29.6 | 4.8 |
| 13 | Birmingham | West Midlands | 1,183,600 | 115.7 | 46.5 | 35.5 | 4.2 |
| 14 | Stoke-on-Trent | Staffordshire | 270,400 | 115.0 | 46.2 | 29.4 | 3.8 |
| 15 | Hastings | Sussex | 91,200 | 113.7 | 39.4 | 38.4 | 1.9 |
| 16 | Portsmouth | Hampshire | 214,300 | 113.4 | 45.4 | 33.0 | 1.9 |
| 17 | Derby | Derbyshire | 274,100 | 113.2 | 46.6 | 28.2 | 2.4 |
| 18 | Leeds | West Yorkshire | 845,200 | 113.1 | 43.5 | 36.6 | 5.0 |
| 19 | Newport | Gwent | 167,900 | 112.4 | 42.8 | 30.3 | 2.8 |
| 20 | Newcastle upon Tyne | Northumbria | 320,600 | 108.8 | 35.6 | 39.1 | 3.6 |
| 21 | Norwich | Norfolk | 147,200 | 108.3 | 40.5 | 33.5 | 1.8 |
| 22 | Leicester | Leicestershire | 388,300 | 106.8 | 39.7 | 29.4 | 2.6 |
| 23 | Gloucester | Gloucestershire | 138,600 | 105.8 | 42.2 | 33.3 | 3.1 |
| 24 | Salford | Greater Manchester | 294,300 | 105.6 | 42.0 | 25.0 | 3.3 |
| 25 | Peterborough | Cambridgeshire | 223,700 | 104.1 | 42.5 | 28.2 | 2.6 |
| 26 | Wakefield | West Yorkshire | 367,700 | 103.1 | 45.6 | 27.0 | 3.1 |
| 27 | Reading | Thames Valley | 182,900 | 100.2 | 34.8 | 37.8 | 2.0 |
| 28 | Preston | Lancashire | 162,900 | 99.6 | 40.5 | 27.6 | 2.4 |
| 29 | Brighton and Hove | Sussex | 283,900 | 99.5 | 32.4 | 34.1 | 1.7 |
| 30 | Sheffield | South Yorkshire | 582,500 | 97.3 | 34.8 | 30.4 | 4.0 |
| 31 | Oxford | Thames Valley | 166,000 | 96.2 | 31.1 | 36.8 | 1.8 |
| 32 | Plymouth | Devon and Cornwall | 272,100 | 94.7 | 43.8 | 22.0 | 1.6 |
| 33 | Cardiff | South Wales | 383,900 | 94.7 | 30.1 | 33.8 | 1.8 |
| 34 | Cambridge | Cambridgeshire | 149,400 | 93.7 | 28.4 | 39.0 | 2.3 |
| 35 | Sunderland | Northumbria | 288,600 | 93.6 | 33.2 | 29.4 | 4.0 |
| 36 | Exeter | Devon and Cornwall | 138,400 | 93.0 | 40.3 | 25.4 | 1.4 |
| 37 | Wolverhampton | West Midlands | 281,300 | 92.4 | 39.1 | 29.4 | 1.6 |
| 38 | Ipswich | Suffolk | 140,300 | 92.2 | 35.0 | 31.7 | 1.5 |
| 39 | Milton Keynes | Thames Valley | 305,900 | 88.9 | 33.8 | 29.5 | 2.3 |
| 40 | Coventry | West Midlands | 369,000 | 88.7 | 34.6 | 29.5 | 3.4 |
| 41 | Carlisle | Cumbria | 114,900 | 88.2 | 37.4 | 17.8 | 1.2 |
| 42 | Canterbury | Kent | 162,100 | 78.4 | 28.2 | 28.5 | 1.6 |
| 43 | Lancaster | Lancashire | 145,000 | 74.3 | 30.3 | 20.7 | 3.0 |
| 44 | Swansea | South Wales | 251,300 | 73.6 | 28.8 | 18.4 | 1.1 |
| 45 | Chelmsford | Essex | 188,800 | 71.7 | 29.6 | 21.3 | 2.1 |
| 46 | York | North Yorkshire | 209,300 | 65.5 | 24.6 | 21.6 | 1.5 |
| 47 | St Albans | Hertfordshire | 151,000 | 63.9 | 21.0 | 27.6 | 2.5 |
| 48 | Winchester | Hampshire | 135,600 | 56.8 | 21.7 | 16.5 | 1.4 |
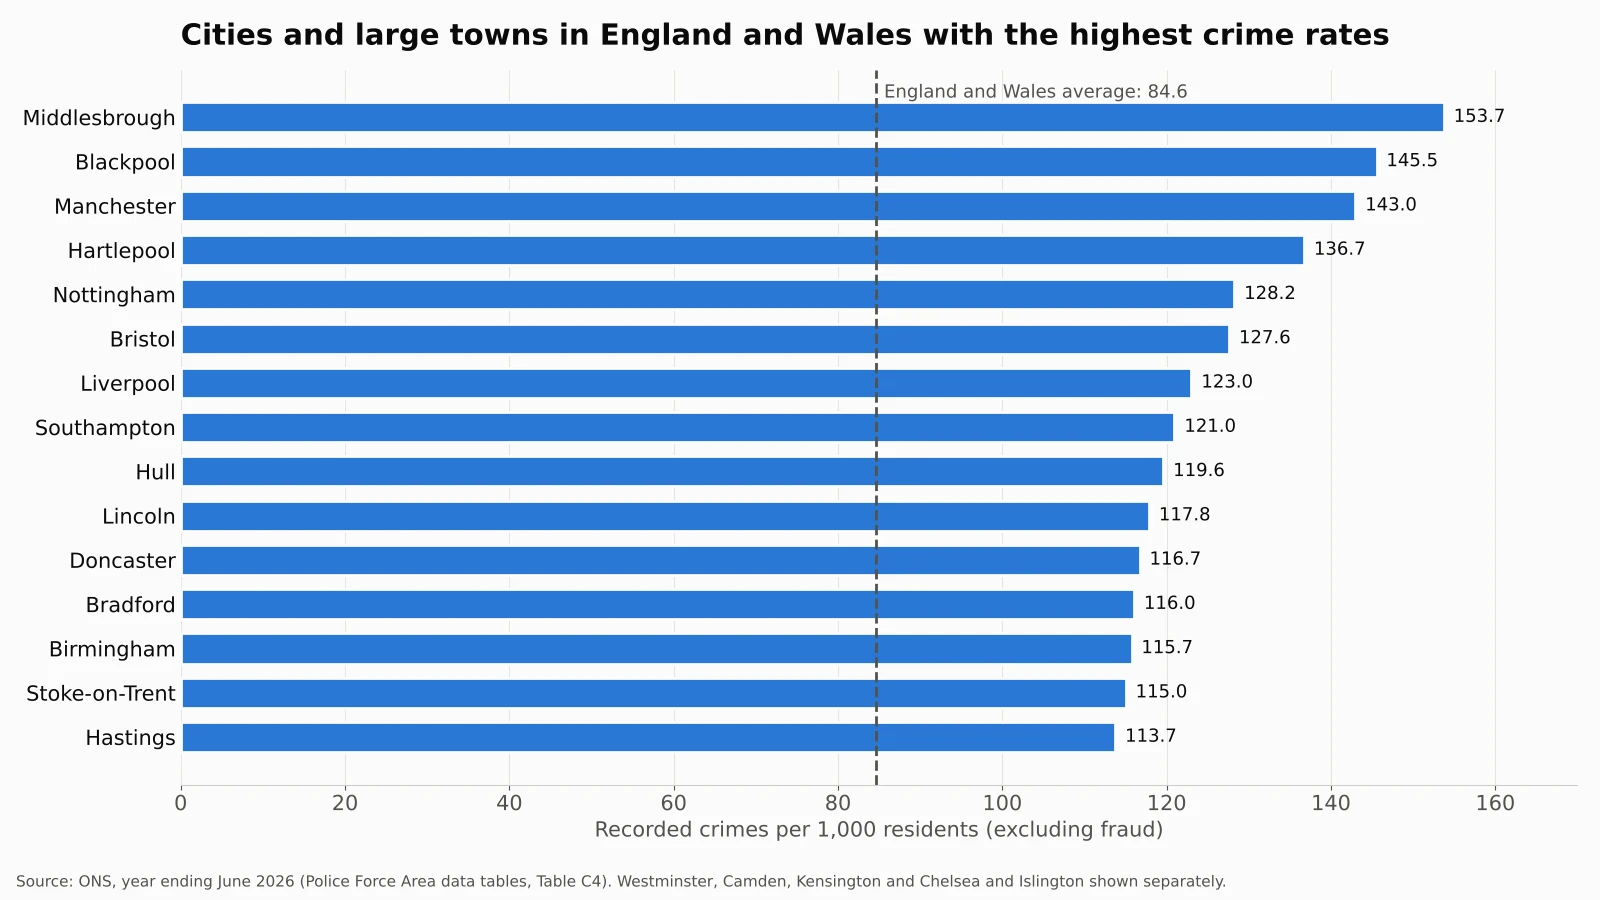
A few patterns stand out right away, starting with a top of the list dominated by the North East and North West, with Middlesbrough, Blackpool, Manchester and Hartlepool all above 135. Most of the lowest rates belong to prosperous southern cathedral and commuter cities. Big cities fall in the middle and upper part of the table, but they are not all at the top. Sheffield, for example, sits at 97.3, which is lower than smaller places like Lincoln, Hastings and Hull.
Three of the top four places are towns rather than cities. Middlesbrough, Blackpool and Hartlepool do not hold formal city status, but they are large urban areas with their own councils, so we kept them in the ranking. If you only count official cities, Manchester leads, followed by Nottingham (128.2) and Bristol (127.6).
How to Read a Crime Rate per 1,000 Residents
A crime rate per 1,000 residents takes the number of crimes the police recorded in an area over 12 months and divides it by the number of people who live there. ONS then multiplies the result by 1,000. In Middlesbrough, about 156,200 residents and a rate of 153.7 work out to roughly 24,000 recorded crimes in the year.
That does not mean one Middlesbrough resident in six or seven became a victim. Many crimes have no single resident victim at all, since shoplifting is a crime against a business and drug possession is usually found by police patrols. Some people are victims more than once, and many victims are visitors from outside the area.
The figures also leave out fraud. Fraud and computer misuse are reported to a national center rather than to local forces, so ONS does not split them by area. In practice, these rates describe crime that takes place in a particular area and is then reported to, and recorded by, its local police force.
Recorded crime also reflects how willing people are to report and how carefully each force records what it is told. ONS treats the Crime Survey for England and Wales as the better guide to long-term trends for this reason. For comparing places at one point in time, though, police recorded crime is the only source with enough local detail, and it is what every crime ranking of UK cities relies on.
One more point is easy to miss, which is that the boundary of a council area can change its rate a great deal. A tight boundary drawn around a busy center will show a high rate, while a wide boundary that takes in quiet suburbs and villages will pull the rate down. Keep this in mind when you compare a compact city like Nottingham with a sprawling one like Leeds.
Highest Crime Rate Cities: Middlesbrough, Blackpool and Manchester
Middlesbrough’s rate of 153.7 is about 1.8 times the England and Wales average. It leads the table on criminal damage and arson, at 20.0 per 1,000, and on robbery, at 3.9. Its violence rate of 54.2 is also high. Neighboring Hartlepool, in the same Cleveland police area, comes fourth overall at 136.7. The Cleveland force as a whole recorded 128.2 crimes per 1,000 people, about 1.5 times the England and Wales average.
Blackpool, in second place at 145.5, has a very different profile. Theft there is fairly ordinary, at 32.6 per 1,000, but violence against the person reaches 69.4. That is the highest violence rate in the table and about 2.2 times the England and Wales figure of 31.7. Violence makes up almost half of all recorded crime in the town. A busy night-time economy and large numbers of visitors help explain part of this, since a visitor who is assaulted adds to the count while the rate is still divided only by Blackpool’s 144,200 residents.
Manchester, at 143.0, is the highest-ranking official city and the highest of the big regional cities. It has the second-highest rate of drug crime (11.3 per 1,000) and the third-highest violence rate (51.8). Its neighbor Salford comes in much lower at 105.6, which shows how much rates can change from one council area to the next.
Nottingham (128.2) and Bristol (127.6) complete the top five official cities with Liverpool close behind at 123.0. Nottingham has the highest overall theft rate in the table at 43.6, and Bristol is close at 42.3. Both are compact council areas with busy shopping centers and large student populations.
Lowest Crime Rate Cities: Winchester, St Albans and York
Winchester has the lowest rate in our table at 56.8 crimes per 1,000 residents, about a third below the England and Wales average. It also has the lowest rates of theft (16.5), shoplifting (5.4), robbery (0.4) and criminal damage (4.4) among the 48 places. For scale, Middlesbrough’s overall rate is about 2.7 times Winchester’s.
St Albans comes second at 63.9 and has the lowest violence rate in the table, at 21.0 per 1,000. York is third at 65.5, which is notable for a major tourist city that draws large crowds to its center all year. Chelmsford (71.7) and Swansea (73.6) round out the five lowest. Swansea also has the lowest burglary and residential burglary rates in the table.
These low-crime cities share some traits. Most are smaller, wealthier places, often with council areas that include a lot of countryside. Some rural districts are lower still: Broadland in Norfolk recorded 34.4 crimes per 1,000 people, and Waverley in Surrey recorded 37.0. The calmest force areas in the data are North Yorkshire (52.3), Wiltshire (56.3) and Surrey (59.3).
If you are weighing up a move and want a low crime rate, our guide to the best cities for digital nomads in Europe covers other factors such as cost of living and internet speed.
London Crime Rate and Why Central Boroughs Look So High
London is policed by the Metropolitan Police, which recorded 101.0 crimes per 1,000 residents across its area. That is about 19% above the England and Wales average, but it is well below Manchester, Middlesbrough and several smaller towns. By our calculation, Manchester’s rate is about 42% higher than London’s.
Within London, a handful of central boroughs show rates that would top any national table. We list them separately because they are not cities in their own right, and because their rates are distorted in a way ONS itself warns about.
| Area | Residents (Mid-2024) | Total Crime Rate | Theft | Shoplifting | Violence Against the Person |
|---|---|---|---|---|---|
| Westminster | 210,000 | 342.1 | 222.0 | 39.6 | 52.9 |
| Camden | 216,900 | 173.5 | 98.5 | 19.2 | 35.6 |
| Kensington and Chelsea | 144,500 | 142.4 | 77.9 | 22.9 | 31.3 |
| Islington | 223,000 | 134.0 | 64.1 | 16.8 | 33.8 |
| Metropolitan Police area (all London) | 9,074,600 | 101.0 | 46.0 | 10.3 | 28.0 |
The problem is the denominator. ONS note 7 explains that rates are calculated on the resident population, so the commuters, shoppers and tourists who crowd central areas each day are not counted. Westminster has about 210,000 residents, yet many more people pass through the West End on a busy day. Crimes against those visitors are counted, but the visitors themselves are not, so the rate climbs.
Westminster’s figure of 342.1 is about four times the England and Wales average, and theft accounts for about 65% of it. Shoplifting alone makes up 39.6 per 1,000, and the rest includes crimes such as pickpocketing and phone theft in crowded streets. The resident of a quiet Westminster side street faces a very different risk from a tourist on Oxford Street.
Violence, Theft, Shoplifting and Drugs: Which Cities Lead Each Crime Type
A single total can hide very different problems, because a city with high theft but low violence feels different from one where the reverse is true. The chart below compares five big English cities across the main crime types.
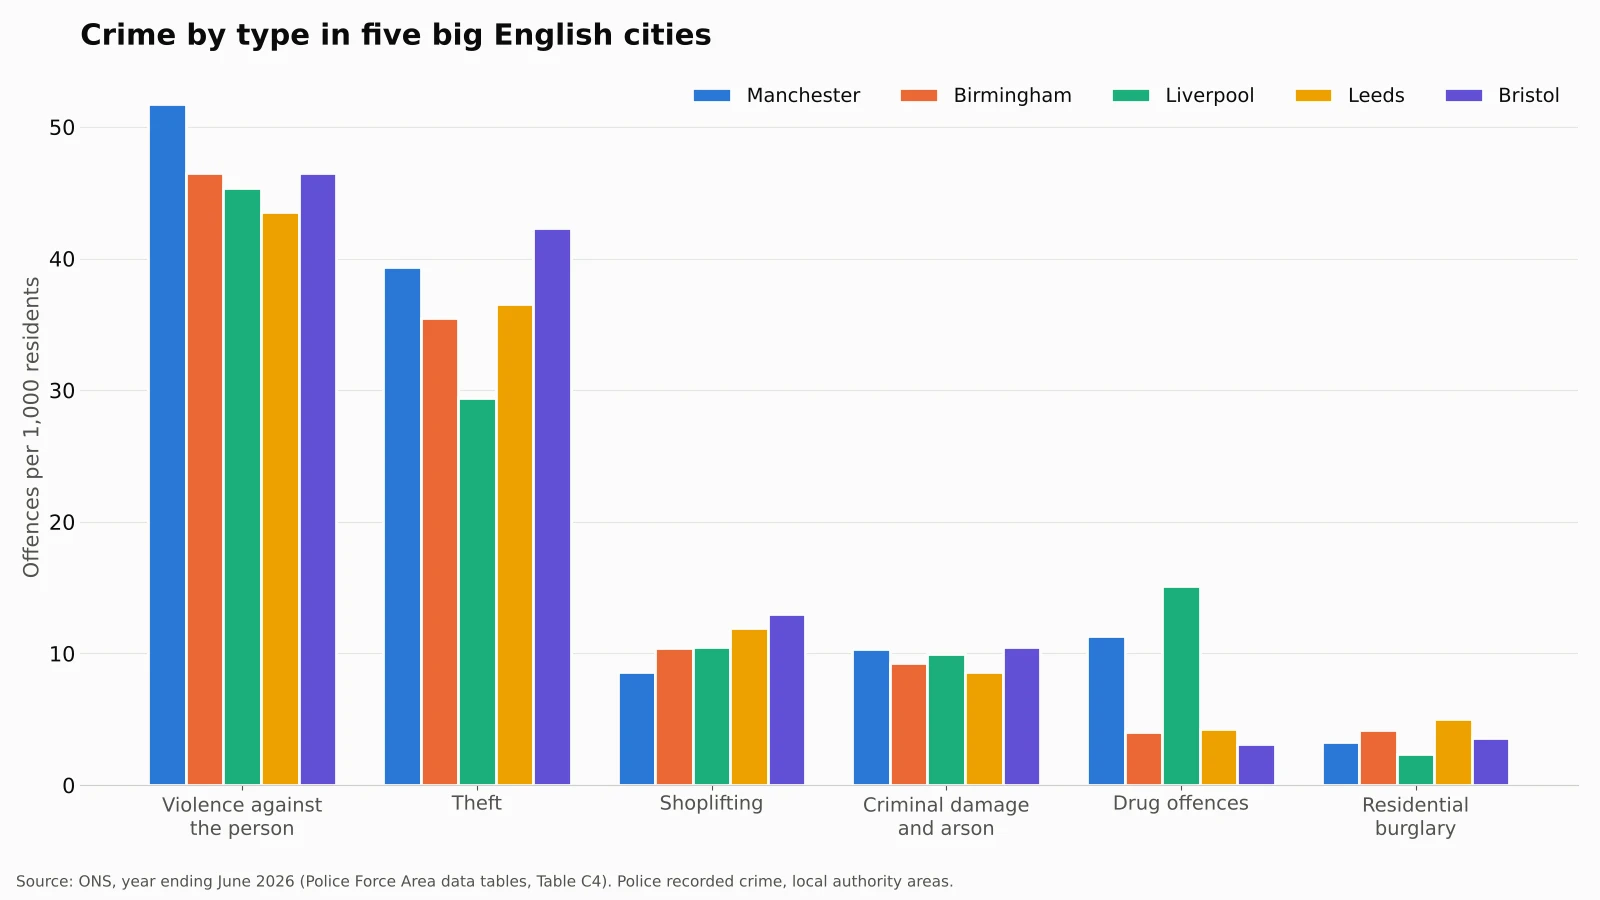
Violence against the person. This is the largest single category almost everywhere, and Blackpool leads at 69.4 per 1,000, followed by Middlesbrough (54.2) and Manchester (51.8). The violence-with-injury figures follow the same order, with Blackpool at 21.2. Blackpool also has the highest rate of sexual offenses, at 6.8.
Theft. Nottingham (43.6), Hartlepool (42.6) and Bristol (42.3) record the most theft per resident. Liverpool, by contrast, records just 29.4, lower than many smaller towns. Carlisle and Winchester have the lowest theft rates, both below 18.
Shoplifting. This is the category that matters most to independent retailers, and Hartlepool records 23.4 shoplifting offenses per 1,000 residents and Lincoln records 22.1. Both rates are about four times Winchester’s 5.4. Hastings (19.5), Middlesbrough (18.2) and Norwich (17.4) are also high.
Residential burglary. Hull has the highest rate at 5.2 per 1,000 residents, with Leeds (5.0) and Bradford (4.8) close behind. Leeds also has the highest rate of all burglary types combined, at 7.0. Swansea’s rate of 1.1 is less than a quarter of Hull’s.
Drug offenses. Liverpool stands out at 15.1 per 1,000, the highest in the table and about four times Birmingham’s 4.0. Drug crime is mostly found through police activity, such as stop and search, so a high rate often reflects where forces focus their effort as much as how common drug use is.
To compare any two of these rates yourself, our percentage calculator will show the percentage difference in a few seconds.
Crime Rates by Region in England and Wales
Regional figures smooth out the extremes of single cities and give a clearer picture of the wider area. These rates come from Table P3 of the same ONS release, which uses mid-2025 population estimates. That is why London’s regional figure (101.4) differs a little from the Metropolitan Police figure (101.0).
| Region or Nation | Crimes per 1,000 Residents | Difference From England and Wales Average |
|---|---|---|
| London | 101.4 | +20% |
| North East | 99.8 | +18% |
| Yorkshire and The Humber | 95.8 | +13% |
| North West | 89.2 | +5% |
| England and Wales | 84.6 | Benchmark |
| England | 83.3 | -2% |
| West Midlands | 83.0 | -2% |
| Wales | 79.6 | -6% |
| East Midlands | 76.5 | -10% |
| South West | 72.4 | -14% |
| South East | 70.0 | -17% |
| East of England | 68.4 | -19% |
London has the highest regional rate, followed by the North East (99.8) and Yorkshire and The Humber (95.8). The East of England is the lowest at 68.4, so by our calculation London’s rate is about 48% higher. The South East and South West are also low, which fits the city table, where southern places such as Winchester, St Albans and Chelmsford take the safest spots.
Wales, at 79.6, sits a little below England’s 83.3. Within Wales the picture is mixed. Newport (112.4) is about 41% above the Welsh average, Cardiff (94.6) is about 19% above it, and Swansea (73.6) is below it.
Crime Rates in Scottish Cities
Scotland publishes its own crime figures, and they are not built the same way. The Scottish Government’s Recorded Crime in Scotland 2025-26 reports rates per 10,000 people. It also separates “crimes” from “offenses”, with many lower-level matters counted as offenses rather than crimes. Because the counting rules differ, a Scottish rate cannot be placed directly beside an English one.
| Area | Crimes per 10,000 People | Equivalent per 1,000 People |
|---|---|---|
| Scotland (national) | 569 | 56.9 |
| Dundee City (highest council area) | 929 | 92.9 |
| Shetland Islands (lowest council area) | 203 | 20.3 |
Scotland recorded 569 crimes per 10,000 people nationally, equal to 56.9 per 1,000. Dundee City had the highest rate of any council area at 929 per 10,000. That is about 63% above the Scottish average. Shetland had the lowest at 203, so Dundee’s rate was about 4.6 times Shetland’s. As in England, the busiest urban council areas record the most crime per resident, while island and rural areas record the least.
How to Check Crime on a Specific Street Before You Move or Open a Shop
City-wide rates are a starting point, not a verdict on a street. Crime clusters in small areas, such as a town center, a retail park or a single estate, and most neighborhoods in a high-rate city are quiet. If you are choosing a home or a business site, check the exact area.
The official tool for this is police.uk. Enter a postcode and it shows a map of recent recorded crimes near that spot, broken down by type and month. It also names your local neighborhood policing team and lists their priorities. Locations on the map are shown approximately to protect victims’ privacy, so treat each dot as “near here” rather than an exact address.
To get a useful picture, follow a simple routine. First, look at at least six to 12 months of data, since one month can be skewed by a single event. Second, compare the crime types with your own needs: a family will care most about burglary and violence, while a shop owner will look at shoplifting and criminal damage. Third, check nearby streets too, because a busy high street next door will make a quiet road look worse on the map.
Visit at different times of day if you can, because a street that feels calm on a weekday morning can be very different on a Friday night, especially near pubs, clubs or a station. Talking to neighbors or nearby business owners will often tell you more than any dataset.
For business owners, the city figures carry a practical message. Shoplifting rates above 15 per 1,000 residents, as in Hartlepool, Lincoln, Hastings, Middlesbrough and Norwich, point to a real cost that should be part of your budget. Security cameras, staff training and good store layout all cost money, so plan for them early. Our small business expense spreadsheet template can help you track those costs. Report every incident to the police, even small ones, because recorded crime figures shape where local forces send their patrols.

London vs Manchester and How Rates per 1,000 Are Worked Out
What Is the Most Dangerous City in the UK?
On recorded crime per resident, Middlesbrough has the highest rate of any large town or city in England and Wales, at 153.7 per 1,000 people. Among places with official city status, Manchester has the highest rate at 143.0. Central London boroughs such as Westminster show higher figures, but those rates are inflated by large numbers of visitors.
What Is the Safest City in England?
Winchester has the lowest rate of the 48 cities and large towns in our table, at 56.8 crimes per 1,000 residents. St Albans (63.9) and York (65.5) come next, while Swansea, at 73.6, has the lowest rate of the Welsh cities we covered.
Is London More Dangerous Than Manchester?
Not on these figures, since the Metropolitan Police area recorded 101.0 crimes per 1,000 residents, while the City of Manchester recorded 143.0. London’s rate is pushed up in central boroughs by visitors, but across the whole capital it is much closer to the national average.
How Is the Crime Rate per 1,000 People Calculated?
ONS divides the number of crimes recorded by the police in an area over 12 months by the number of people who live there, then multiplies by 1,000. The figures in this guide exclude fraud and cover July 2025 to June 2026.
Is Crime Higher in Scotland Than in England?
Scotland recorded 569 crimes per 10,000 people in 2025-26, or 56.9 per 1,000, against 83.3 per 1,000 in England. However, Scotland counts many lower-level matters as offenses rather than crimes, so the two rates are not directly comparable.
For more data-led guides on where people live and work, see our list of cities with free public transportation or browse the Lifestyle section.