


Price to Sales Ratio by Industry Across 94 US Sectors
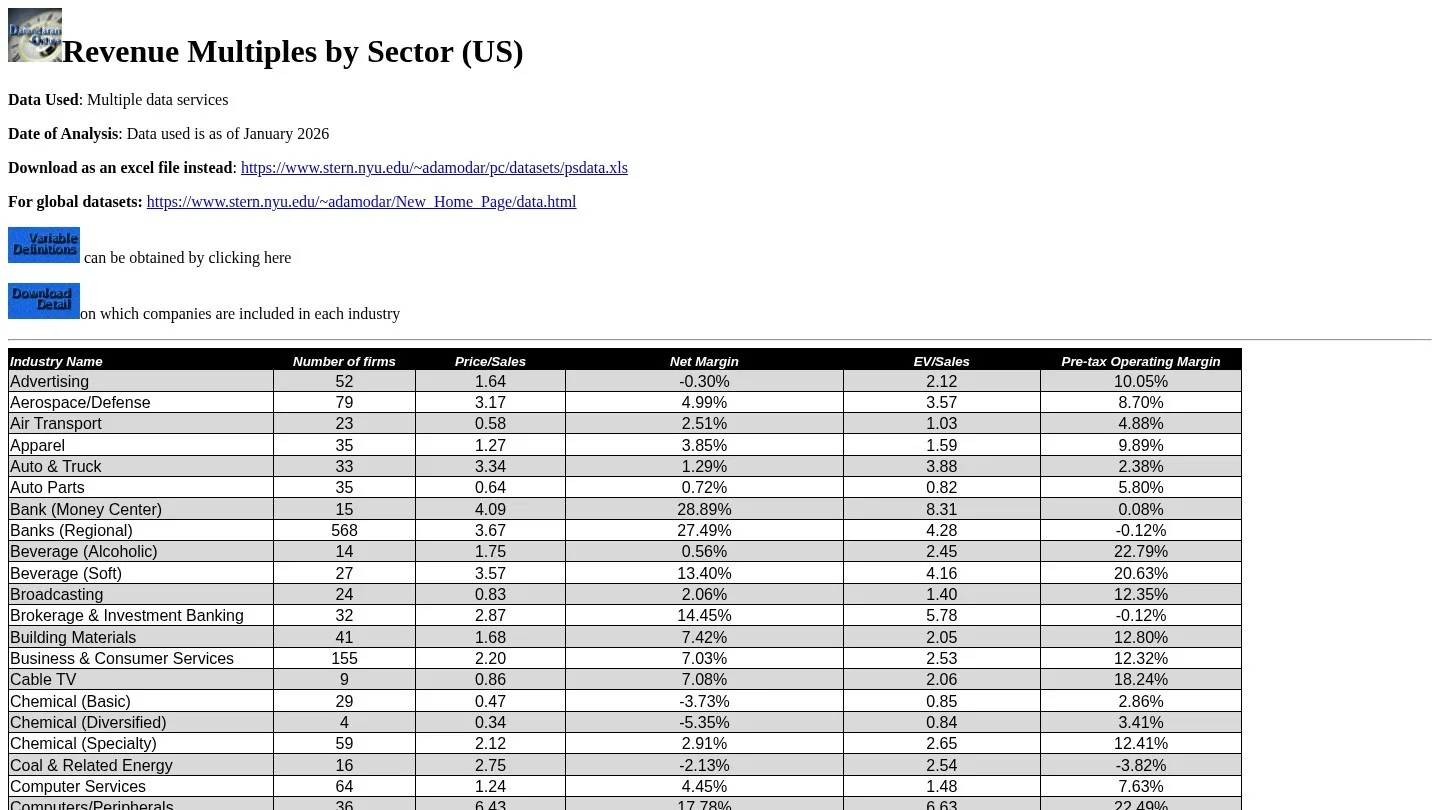
The average price to sales ratio for the US stock market is 3.07. That figure covers 5,994 listed companies in the January 2026 industry data we compiled for this page. But the spread between industries is huge. Chip makers trade at 15.46 times revenue. Food wholesalers trade at 0.31 times.
So a fair P/S ratio depends on the industry first. We ranked all 94 industries by P/S. Then we added our own implied P/E for each one, because profit margins explain most of the gap.
| Rank | Industry | Firms | P/S ratio | Net margin | EV/Sales | Implied P/E (our calculation) |
|---|---|---|---|---|---|---|
| 1 | Semiconductor | 66 | 15.46 | 30.45% | 15.70 | 50.8 |
| 2 | Software (System & Application) | 309 | 11.01 | 25.49% | 11.41 | 43.2 |
| 3 | Software (Entertainment) | 77 | 9.01 | 29.93% | 9.13 | 30.1 |
| 4 | Software (Internet) | 29 | 8.76 | -0.93% | 9.56 | Loss |
| 5 | Retail (REITs) | 26 | 7.82 | 23.00% | 12.04 | 34.0 |
| 6 | Semiconductor Equipment | 31 | 7.49 | 21.32% | 7.61 | 35.1 |
| 7 | Drugs (Biotechnology) | 496 | 7.31 | -5.00% | 7.92 | Loss |
| 8 | Computers/Peripherals | 36 | 6.43 | 17.78% | 6.63 | 36.2 |
| 9 | Telecom. Equipment | 57 | 6.13 | 16.09% | 6.52 | 38.1 |
| 10 | R.E.I.T. | 190 | 5.89 | 13.23% | 10.65 | 44.5 |
| 11 | Precious Metals | 56 | 5.84 | 28.59% | 5.98 | 20.4 |
| 12 | Drugs (Pharmaceutical) | 228 | 5.63 | 18.54% | 6.24 | 30.4 |
| 13 | Tobacco | 10 | 5.30 | 26.65% | 6.40 | 19.9 |
| 14 | Transportation (Railroads) | 4 | 5.26 | 24.73% | 6.67 | 21.3 |
| 15 | Financial Svcs. (Non-bank & Insurance) | 176 | 5.22 | 22.19% | 18.91 | 23.5 |
| 16 | Real Estate (General/Diversified) | 12 | 4.82 | 23.77% | 6.83 | 20.3 |
| 17 | Healthcare Information and Technology | 115 | 4.70 | 7.45% | 5.31 | 63.1 |
| 18 | Investments & Asset Management | 283 | 4.59 | 18.36% | 5.49 | 25.0 |
| 19 | Utility (Water) | 14 | 4.43 | 21.16% | 7.16 | 20.9 |
| 20 | Healthcare Products | 204 | 4.36 | 9.61% | 4.76 | 45.4 |
| 21 | Bank (Money Center) | 15 | 4.09 | 28.89% | 8.31 | 14.2 |
| 22 | Electrical Equipment | 112 | 4.09 | 0.94% | 4.42 | n/m |
| 23 | Entertainment | 92 | 3.87 | 4.43% | 4.33 | 87.4 |
| 24 | Metals & Mining | 73 | 3.81 | 10.52% | 4.03 | 36.2 |
| 25 | Green & Renewable Energy | 15 | 3.76 | -10.83% | 7.87 | Loss |
| 26 | Banks (Regional) | 568 | 3.67 | 27.49% | 4.28 | 13.4 |
| 27 | Beverage (Soft) | 27 | 3.57 | 13.40% | 4.16 | 26.6 |
| 28 | Insurance (General) | 21 | 3.53 | 12.37% | 4.32 | 28.5 |
| 29 | Auto & Truck | 33 | 3.34 | 1.29% | 3.88 | 258.9 |
| 30 | Restaurant/Dining | 64 | 3.34 | 9.37% | 4.17 | 35.6 |
| 31 | Hotel/Gaming | 63 | 3.26 | 10.38% | 4.33 | 31.4 |
| 32 | Aerospace/Defense | 79 | 3.17 | 4.99% | 3.57 | 63.5 |
| 33 | Environmental & Waste Services | 53 | 3.09 | 8.24% | 3.70 | 37.5 |
| 34 | Machinery | 105 | 3.08 | 10.58% | 3.43 | 29.1 |
| 35 | Electronics (General) | 114 | 3.02 | 6.47% | 3.21 | 46.7 |
| 36 | Utility (General) | 14 | 2.90 | 14.18% | 5.25 | 20.5 |
| 37 | Brokerage & Investment Banking | 32 | 2.87 | 14.45% | 5.78 | 19.9 |
| 38 | Diversified | 20 | 2.85 | 16.37% | 3.08 | 17.4 |
| 39 | Construction Supplies | 40 | 2.83 | 10.78% | 3.23 | 26.3 |
| 40 | Oil/Gas Distribution | 23 | 2.78 | 13.35% | 4.37 | 20.8 |
| 41 | Coal & Related Energy | 16 | 2.75 | -2.13% | 2.54 | Loss |
| 42 | Power | 46 | 2.74 | 12.73% | 4.70 | 21.5 |
| 43 | Household Products | 110 | 2.67 | 11.68% | 3.06 | 22.9 |
| 44 | Telecom (Wireless) | 12 | 2.48 | 12.24% | 3.72 | 20.3 |
| 45 | Business & Consumer Services | 155 | 2.20 | 7.03% | 2.53 | 31.3 |
| 46 | Chemical (Specialty) | 59 | 2.12 | 2.91% | 2.65 | 72.9 |
| 47 | Retail (General) | 23 | 2.01 | 5.61% | 2.11 | 35.8 |
| 48 | Oil/Gas (Production and Exploration) | 142 | 2.00 | 14.63% | 2.68 | 13.7 |
| 49 | Shoe | 11 | 1.95 | 6.27% | 2.04 | 31.1 |
| 50 | Retail (Building Supply) | 14 | 1.85 | 7.84% | 2.26 | 23.6 |
| 51 | Real Estate (Development) | 14 | 1.77 | 7.01% | 3.03 | 25.2 |
| 52 | Beverage (Alcoholic) | 14 | 1.75 | 0.56% | 2.45 | n/m |
| 53 | Education | 32 | 1.74 | 8.79% | 1.99 | 19.8 |
| 54 | Information Services | 15 | 1.70 | 6.53% | 2.21 | 26.0 |
| 55 | Building Materials | 41 | 1.68 | 7.42% | 2.05 | 22.6 |
| 56 | Advertising | 52 | 1.64 | -0.30% | 2.12 | Loss |
| 57 | Engineering/Construction | 48 | 1.58 | 5.94% | 1.74 | 26.6 |
| 58 | Oil/Gas (Integrated) | 4 | 1.58 | 8.30% | 1.75 | 19.0 |
| 59 | Retail (Distributors) | 62 | 1.51 | 6.05% | 1.89 | 25.0 |
| 60 | Publishing & Newspapers | 19 | 1.47 | 8.19% | 1.70 | 17.9 |
| 61 | Shipbuilding & Marine | 8 | 1.45 | 9.48% | 1.74 | 15.3 |
| 62 | Retail (Special Lines) | 94 | 1.43 | 5.19% | 1.63 | 27.6 |
| 63 | Trucking | 26 | 1.42 | 3.79% | 1.74 | 37.5 |
| 64 | Telecom. Services | 39 | 1.39 | 14.20% | 2.61 | 9.8 |
| 65 | Insurance (Prop/Cas.) | 57 | 1.36 | 11.13% | 1.49 | 12.2 |
| 66 | Apparel | 35 | 1.27 | 3.85% | 1.59 | 33.0 |
| 67 | Transportation | 19 | 1.27 | 8.23% | 1.64 | 15.4 |
| 68 | Recreation | 49 | 1.26 | -4.72% | 1.94 | Loss |
| 69 | Computer Services | 64 | 1.24 | 4.45% | 1.48 | 27.9 |
| 70 | Real Estate (Operations & Services) | 54 | 1.24 | 1.19% | 1.46 | 104.2 |
| 71 | Hospitals/Healthcare Facilities | 31 | 1.08 | 6.30% | 1.69 | 17.1 |
| 72 | Homebuilding | 30 | 1.07 | 9.47% | 1.19 | 11.3 |
| 73 | Food Processing | 78 | 1.05 | 2.82% | 1.47 | 37.2 |
| 74 | Packaging & Container | 19 | 1.03 | 4.48% | 1.55 | 23.0 |
| 75 | Office Equipment & Services | 14 | 1.02 | 4.38% | 1.43 | 23.3 |
| 76 | Steel | 19 | 0.99 | 1.93% | 1.17 | 51.3 |
| 77 | Furn/Home Furnishings | 27 | 0.98 | 1.10% | 1.33 | 89.1 |
| 78 | Electronics (Consumer & Office) | 8 | 0.96 | -9.42% | 0.91 | Loss |
| 79 | Insurance (Life) | 20 | 0.95 | 7.80% | 1.28 | 12.2 |
| 80 | Farming/Agriculture | 35 | 0.92 | 3.91% | 1.34 | 23.5 |
| 81 | Retail (Automotive) | 34 | 0.89 | 3.36% | 1.27 | 26.5 |
| 82 | Cable TV | 9 | 0.86 | 7.08% | 2.06 | 12.1 |
| 83 | Broadcasting | 24 | 0.83 | 2.06% | 1.40 | 40.3 |
| 84 | Paper/Forest Products | 6 | 0.76 | 3.44% | 1.02 | 22.1 |
| 85 | Auto Parts | 35 | 0.64 | 0.72% | 0.82 | n/m |
| 86 | Reinsurance | 1 | 0.60 | 3.89% | 0.65 | 15.4 |
| 87 | Air Transport | 23 | 0.58 | 2.51% | 1.03 | 23.1 |
| 88 | Oilfield Svcs/Equip. | 97 | 0.57 | 2.34% | 0.74 | 24.4 |
| 89 | Chemical (Basic) | 29 | 0.47 | -3.73% | 0.85 | Loss |
| 90 | Healthcare Support Services | 104 | 0.37 | 1.25% | 0.46 | 29.6 |
| 91 | Chemical (Diversified) | 4 | 0.34 | -5.35% | 0.84 | Loss |
| 92 | Retail (Grocery and Food) | 15 | 0.34 | 1.32% | 0.49 | 25.8 |
| 93 | Food Wholesalers | 13 | 0.31 | 1.17% | 0.46 | 26.5 |
| 94 | Rubber & Tires | 3 | 0.14 | -9.49% | 0.59 | Loss |
| All | Total US market | 5,994 | 3.07 | 9.74% | 3.97 | 31.5 |
| All | Total US market without financials | 4,822 | 3.03 | 8.56% | 3.46 | 35.4 |
Each column measures something different. P/S is market value divided by revenue. EV/Sales also adds debt and takes away cash. Our implied P/E is P/S divided by net margin. We mark it “Loss” when the industry lost money. We also mark it “n/m” when the margin is under 1%, since a tiny margin makes the result jump.

Industries With the Highest Price to Sales Ratios
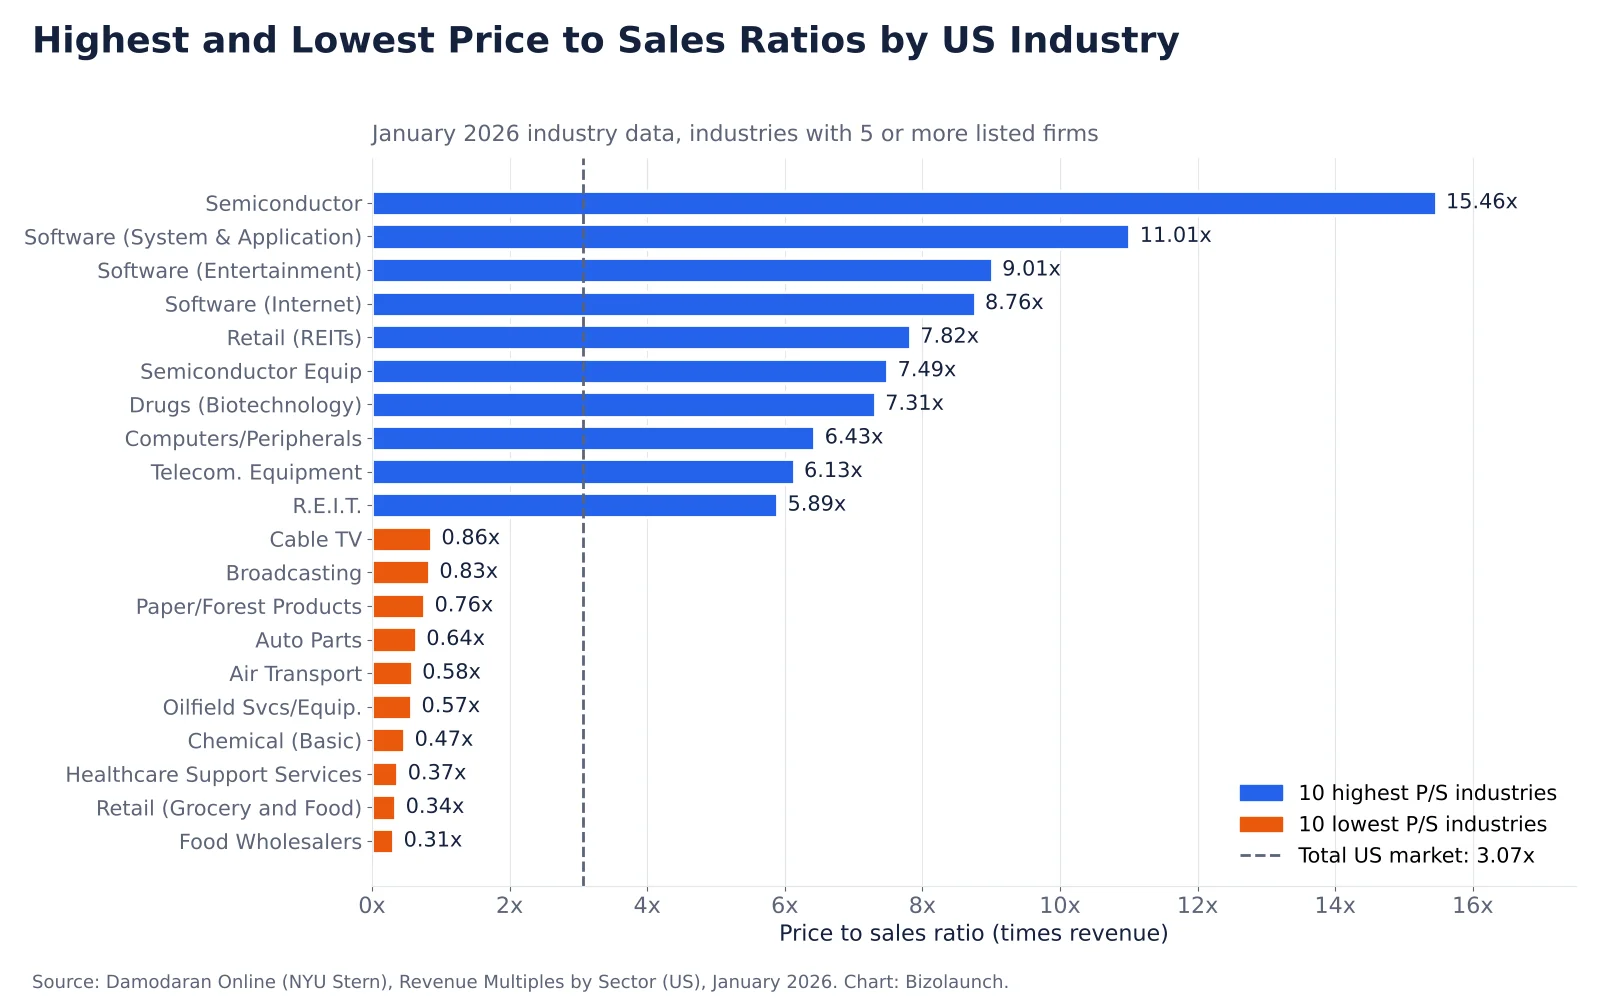
Chip makers top the list. The 66 semiconductor firms trade at 15.46 times sales, about five times the market. In fact, they also earn a 30.45% net margin. No other group with more than 20 firms keeps that much profit from each sale.
Software comes next. System and application software trades at 11.01, entertainment software at 9.01 and internet software at 8.76. However, internet software is the odd one. Its net margin is -0.93%, yet buyers still pay almost nine times revenue. That price rests on future growth, since current profit is close to zero.
Biotech shows the same pattern on a bigger scale. With 496 firms, it is the second largest group in the data. It trades at 7.31 times sales with a -5.00% net margin. For many small biotechs, the value sits in products that are not on sale yet.
Property trusts also make the top 10. Retail REITs trade at 7.82 and all REITs at 5.89. Rent carries high margins, so each dollar of revenue is worth more. Still, REITs borrow a lot, and their EV/Sales figures tell that part of the story.
Industries Trading Under One Times Revenue
We counted 19 industries that trade under 1.0 times sales. Most of them sell high volumes at thin margins. For example, food wholesalers sit at 0.31 with a 1.17% net margin. Grocery stores sit at 0.34 with a 1.32% margin. So a grocer keeps a little over one cent from each dollar it rings up. The market pays about a third of a dollar for that sale.
Healthcare support services work the same way at 0.37. Next come oilfield services, airlines and auto parts makers, between 0.57 and 0.64. All three are cyclical. Also, all three posted net margins between 0.72% and 2.51%.
A few groups are too small to trust. Rubber and tires has three firms at 0.14. Diversified chemicals has four firms at 0.34, and reinsurance has a single firm at 0.60. That is why we kept groups with fewer than five firms out of the chart. One company can swing their number.
Calculate a Company’s Price to Sales Ratio
The formula comes in two forms, and both give the same answer.
- Company level: P/S = market value of all shares ÷ revenue for the last 12 months.
- Per share: P/S = share price ÷ revenue per share.
For example, take a made-up grocery chain with 50 million shares at $18 each. Its market value is $900 million. It booked $2.4 billion of sales in the last four quarters. So its P/S is 0.375.
Next, compare it with its peers. Grocery stores trade at 0.34, so this chain sits about 10% above its industry. You can check that gap with our percentage calculator. But a premium alone is not a warning sign.
Then check profit. Say the chain earns a 1.8% net margin, or $43.2 million. Its P/E is then about 20.8. In contrast, the grocery industry’s implied P/E is 25.8. So the stock looks pricier on sales but cheaper on profit. That second view usually matters more.
Use the last four quarters of revenue for a fair comparison. A forward P/S uses next year’s forecast instead, which mixes a guess into the ratio. Our guide to sales forecasting methods shows how those forecasts get built.
Why Profit Margins Explain Most of the Gap
P/S equals P/E multiplied by net margin. The math is short. Price over sales equals price over earnings times earnings over sales. As a result, two industries with the same P/E can show very different P/S ratios if one keeps more of each sale.
We tested this across the data. For the 85 non-financial industries, the correlation between P/S and pre-tax operating margin is 0.65. Across all 94 industries, the link between P/S and net margin comes out at 0.63. Both point the same way, though neither is perfect.
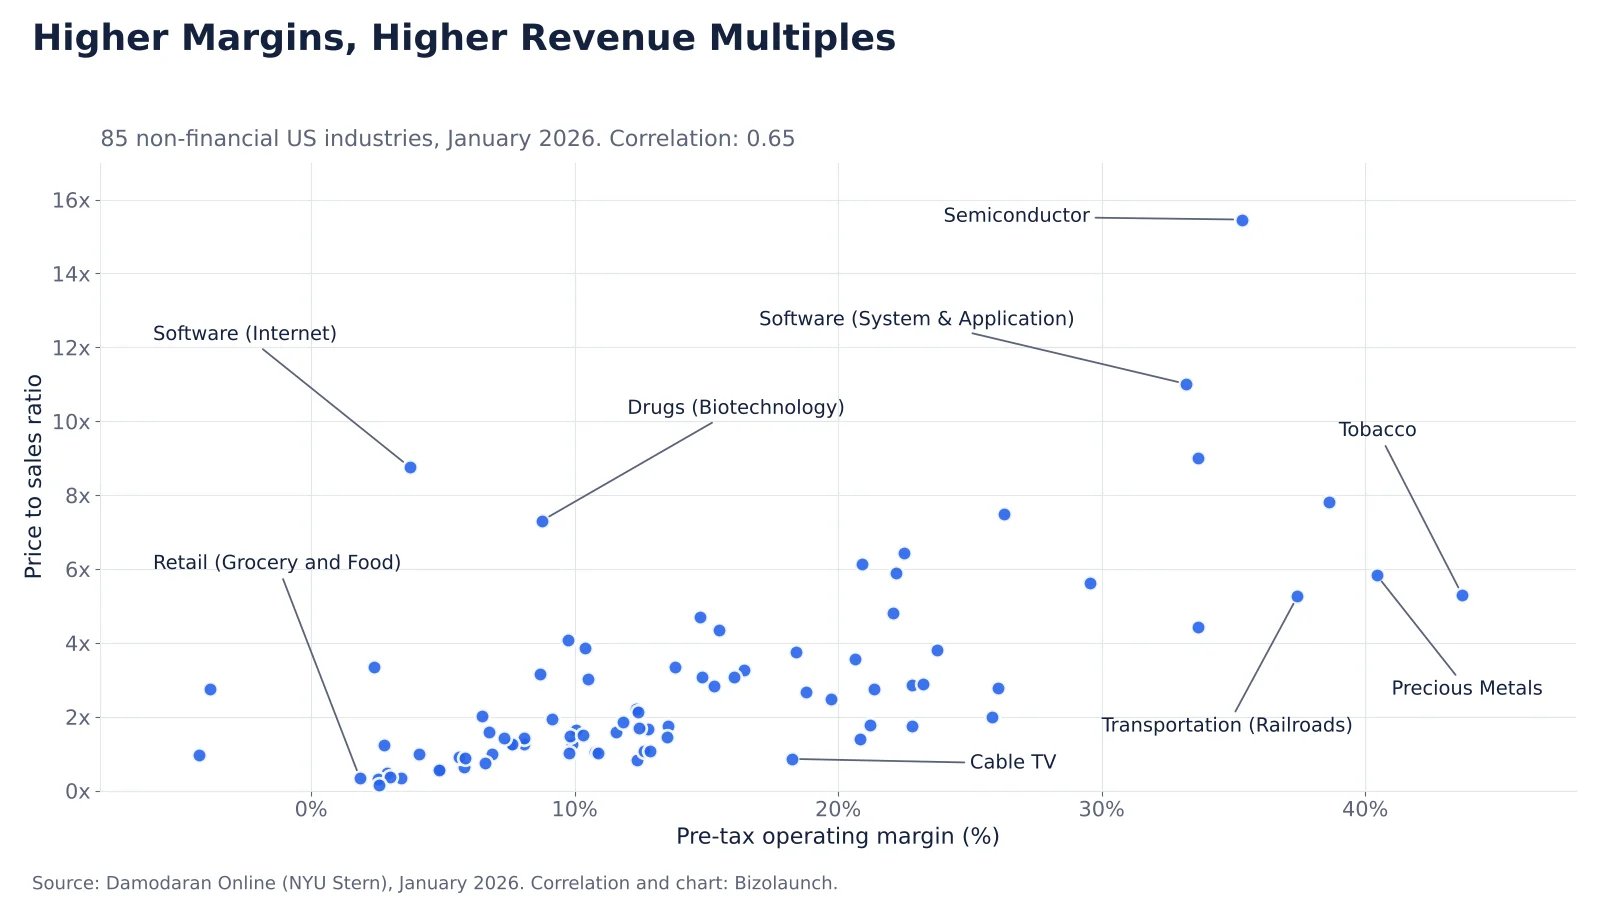
The dots far above the trend are growth bets. Internet software and biotech both trade above seven times sales on operating margins under 9%. On the other hand, cable TV sits far under the trend. It earns an 18.24% operating margin yet trades at 0.86 times sales. Its EV/Sales of 2.06 is more than double its P/S, so debt makes up much of its value.
What Our Implied P/E Figures Show
For the whole market, 3.07 divided by a 9.74% margin gives an implied P/E of 31.5. Auto and truck makers sit far above that at 258.9. Their P/S of 3.34 is close to the market, but their net margin is only 1.29%. So buyers pay an average sales multiple for very thin profit.
At the other end, telecom services come out at 9.8. Homebuilders follow at 11.3 and cable TV at 12.1. Banks land between 13.4 and 14.2. These are the groups where a low P/E, more than a low margin, keeps the sales multiple down.
When EV to Sales Gives a Truer Picture
P/S counts only the value of the shares. Enterprise value adds debt and takes away cash. So for firms that borrow heavily, EV/Sales shows the full price a buyer pays for each dollar of revenue.
| Industry | P/S | EV/Sales | Gap |
|---|---|---|---|
| Financial services (non-bank and insurance) | 5.22 | 18.91 | 13.69 |
| REITs | 5.89 | 10.65 | 4.76 |
| Retail REITs | 7.82 | 12.04 | 4.22 |
| Money center banks | 4.09 | 8.31 | 4.22 |
| Green and renewable energy | 3.76 | 7.87 | 4.11 |
| Brokerage and investment banking | 2.87 | 5.78 | 2.91 |
| Water utilities | 4.43 | 7.16 | 2.73 |
| General utilities | 2.90 | 5.25 | 2.35 |
| Semiconductors (for contrast) | 15.46 | 15.70 | 0.24 |
The gap is widest in finance, property and power. For instance, renewable energy firms more than double, from 3.76 to 7.87. However, chip makers barely move, from 15.46 to 15.70. So for capital-heavy industries, compare EV/Sales. For firms with little debt, P/S works fine.
Banks need extra care. Their revenue is mostly interest and fees, and the interest they pay depositors is a cost of doing business. For banks, a sales multiple says little. Price to book and P/E tell you more.
Value a Business With an Industry P/S Multiple
Founders often use revenue multiples to put a rough price on a company. The method works best as a range check. We walked through the steps with a made-up software firm.
- Pick the right industry. A firm that sells business software maps to System and Application Software at 11.01.
- Multiply by trailing revenue. With $12 million in sales, the raw answer is about $132.1 million.
- Adjust for margin. The industry earns a 25.49% net margin, so its implied P/E is 43.2. Our firm earns 8%. So we multiply 43.2 by 8% and get a P/S of 3.46. That puts the value near $41.5 million.
- Cross-check with EV. Software EV/Sales is 11.41, close to its P/S. So debt does not change the picture here.
The two answers differ by about $90 million. In fact, that gap is the whole lesson. An industry average multiple assumes industry margins. So adjust for your own margin before you quote a number.
Also, these multiples come from listed firms with liquid shares. Treat the result as a starting point for talks with the types of investors you plan to approach. The round you raise matters too, and our guide to types of company funding sets out the options. For SaaS founders, your SaaS pricing model shapes the margin you can show.
Mistakes That Make a P/S Ratio Mislead
We found the same errors again and again when we compared P/S figures across sectors.
- Comparing across industries. A P/S of 2 is pricey for a grocer at 0.34. But it is cheap for a chip maker at 15.46.
- Ignoring losses. Sales can grow while losses grow too. Internet software trades near nine times sales with a negative net margin.
- Trusting tiny groups. Reinsurance has one firm in this data, so its 0.60 is one company’s ratio.
- Using one year in a cyclical industry. Oilfield services and steel move with commodity prices. One year of sales can sit far from normal.
- Using the wrong share count. Count diluted shares when you work out market value. Our guide to calculating your average stock price covers your own cost per share, which is a separate number.
Corporate actions can also confuse new investors. For example, a split cuts the share price and the sales per share by the same amount. So P/S stays the same, as our explainer on stock splits and bonus issues shows with numbers.
Price to Sales Questions Investors Ask
What Is a Good Price to Sales Ratio?
It depends on the industry. The US market average is 3.07, and the middle industry in our ranking sits at about 2.0. A stock that trades under its industry’s P/S, with similar margins, may be cheap. Still, check debt and growth first.
Is a Lower P/S Ratio Always Better?
No. A low P/S often reflects thin margins. Grocery stores trade at 0.34 because they keep about 1.3 cents from each dollar of sales. So a low ratio is only a bargain when margins can hold up.
What Is the Average P/S Ratio of the US Stock Market?
The total US market trades at 3.07 times sales across 5,994 firms. Without financial firms, the figure is 3.03 across 4,822 firms.
How Is P/S Different From EV to Sales?
P/S uses the value of shares only. EV to sales adds debt and subtracts cash. Because of that, EV to sales is the better measure for utilities, REITs and other heavy borrowers.
Why Do Software Companies Have High P/S Ratios?
Mostly because of margins. System and application software firms earn a 25.49% net margin and a 33.21% pre-tax operating margin. So each dollar of sales turns into far more profit than in most industries.
This page is for information and education only and is not investment, tax or financial advice. Confirm current details with the official source or a registered adviser before acting.
Data and Method Behind These Industry Multiples
Industry P/S, net margin, EV/Sales and operating margin figures come from Aswath Damodaran’s January 2026 US industry data at NYU Stern. It covers 5,994 listed US firms in 94 industries. The ranking, implied P/E column, correlations, EV gaps, charts and worked examples are Bizolaunch calculations. The grocery chain and the software firm in the examples are made up to show the math.